ICICI Bank 2013 Annual Report Download - page 141
Download and view the complete annual report
Please find page 141 of the 2013 ICICI Bank annual report below. You can navigate through the pages in the report by either clicking on the pages listed below, or by using the keyword search tool below to find specific information within the annual report.-
 1
1 -
2
-
3
-
4
-
5
-
6
-
7
-
8
-
9
-
10
-
11
-
12
-
13
-
14
-
15
-
16
-
17
-
18
-
19
-
20
-
21
-
22
-
23
-
24
-
25
-
26
-
27
-
28
-
29
-
30
-
31
-
32
-
33
-
34
-
35
-
36
-
37
-
38
-
39
-
40
-
41
-
42
-
43
-
44
-
45
-
46
-
47
-
48
-
49
-
50
-
51
-
52
-
53
-
54
-
55
-
56
-
57
-
58
-
59
-
60
-
61
-
62
-
63
-
64
-
65
-
66
-
67
-
68
-
69
-
70
-
71
-
72
-
73
-
74
-
75
-
76
-
77
-
78
-
79
-
80
-
81
-
82
-
83
-
84
-
85
-
86
-
87
-
88
-
89
-
90
-
91
-
92
-
93
-
94
-
95
-
96
-
97
-
98
-
99
-
100
-
101
-
102
-
103
-
104
-
105
-
106
-
107
-
108
-
109
-
110
-
111
-
112
-
113
-
114
-
115
-
116
-
117
-
118
-
119
-
120
-
121
-
122
-
123
-
124
-
125
-
126
-
127
-
128
-
129
-
130
-
 131
131 -
 132
132 -
 133
133 -
 134
134 -
 135
135 -
 136
136 -
 137
137 -
 138
138 -
 139
139 -
 140
140 -
 141
141 -
 142
142 -
 143
143 -
 144
144 -
 145
145 -
 146
146 -
 147
147 -
 148
148 -
 149
149 -
 150
150 -
 151
151 -
152
-
153
-
154
-
155
-
156
-
157
-
158
-
159
-
160
-
161
-
162
-
163
-
164
-
165
-
166
-
167
-
168
-
169
-
170
-
171
-
172
-
173
-
174
-
175
-
176
-
177
-
178
-
179
-
180
-
181
-
182
-
183
-
184
-
185
-
186
-
187
-
188
-
189
-
190
-
191
-
192
-
193
-
194
-
195
-
196
-
197
-
198
-
199
-
200
-
201
-
202
-
203
-
204
-
205
-
206
-
207
-
208
-
209
-
210
-
211
-
212
-
213
-
214
-
215
-
216
-
217
-
218
-
219
-
220
 |
 |

F63
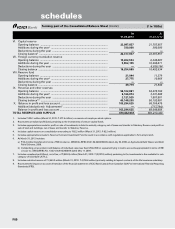
forming part of the Consolidated Balance Sheet (Contd.) (` in ‘000s)
At
31.03.2013
At
31.03.2012
SCHEDULE 8 - INVESTMENTS
I. Investments in India (net of provisions)
i) Government securities ........................................................................ 1,097,604,436 993,524,949
ii) Other approved securities .................................................................. —4,250
iii) Shares (includes equity and preference shares)1 .............................. 51,197,259 41,536,762
iv) Debentures and bonds ........................................................................ 264,433,133 254,442,730
v) Assets held to cover linked liabilities of life insurance business ....... 575,208,274 578,173,746
vi) Others (commercial paper, mutual fund units, pass through
certificates, security receipts, certificate of deposits, Rural
Infrastructure Development Fund deposits and other related
investments) ........................................................................................ 472,423,718 410,125,260
TOTAL INVESTMENTS IN INDIA .......................................................................... 2,460,866,820 2,277,807,697
II. Investments outside India (net of provisions)
i) Government securities ........................................................................ 48,086,185 67,140,077
ii) Others (equity shares, bonds and certificate of deposits) ................. 47,713,781 53,693,138
TOTAL INVESTMENTS OUTSIDE INDIA .............................................................. 95,799,966 120,833,215
TOTAL INVESTMENTS .......................................................................................... 2,556,666,786 2,398,640,912
A. Investments in India
Gross value of investments2 ......................................................................... 2,485,525,836 2,305,164,599
Less: Aggregate of provision/depreciation/(appreciation) .......................... 24,659,016 27,356,902
Net investments............................................................................................. 2,460,866,820 2,277,807,697
B. Investments outside India
Gross value of investments .......................................................................... 95,528,312 123,846,674
Less: Aggregate of provision/depreciation/(appreciation) .......................... (271,654) 3,013,459
Net investments............................................................................................. 95,799,966 120,833,215
TOTAL INVESTMENTS .......................................................................................... 2,556,666,786 2,398,640,912
1. Includes acquisition cost of investment in associates amounting to ` 1,443.5 million (March 31, 2012: ` 494.9 million).
2. Includes appreciation amounting to ` 39,321.6 million (appreciation at March 31, 2012: ` 27,322.5 million) on investments held to cover linked
liabilities of life insurance business.
SCHEDULE 9 - ADVANCES (net of provisions)
A. i) Bills purchased and discounted ............................................................ 69,689,970 59,774,883
ii) Cash credits, overdrafts and loans repayable on demand .................. 455,660,112 339,590,153
iii) Term loans ............................................................................................. 2,774,391,183 2,521,889,143
TOTAL ADVANCES ........................................................................................................ 3,299,741,265 2,921,254,179
B. i) Secured by tangible assets [includes advances against book debts] 2,777,704,336 2,426,141,317
ii) Covered by bank/government guarantees ........................................... 22,221,201 13,869,020
iii) Unsecured .............................................................................................. 499,815,728 481,243,842
TOTAL ADVANCES ....................................................................................................... 3,299,741,265 2,921,254,179
C. I. Advances in India
i) Priority sector ......................................................................................... 593,479,333 592,856,433
ii) Public sector ........................................................................................... 13,438,496 11,968,345
iii) Banks ...................................................................................................... 187,857 154,618
iv) Others .................................................................................................... 1,613,882,876 1,290,662,186
TOTAL ADVANCES IN INDIA ........................................................................................ 2,220,988,562 1,895,641,582
II. Advances outside India
i) Due from banks ...................................................................................... 17,492,429 27,655,594
ii) Due from others
a) Bills purchased and discounted ................................................... 21,068,811 6,357,136
b) Syndicated and term loans .......................................................... 885,757,203 845,174,352
c) Others ........................................................................................... 154,434,260 146,425,515
TOTAL ADVANCES OUTSIDE INDIA ............................................................................ 1,078,752,703 1,025,612,597
TOTAL ADVANCES ........................................................................................................ 3,299,741,265 2,921,254,179
schedules