ICICI Bank 2013 Annual Report Download - page 202
Download and view the complete annual report
Please find page 202 of the 2013 ICICI Bank annual report below. You can navigate through the pages in the report by either clicking on the pages listed below, or by using the keyword search tool below to find specific information within the annual report.-
 1
1 -
2
-
3
-
4
-
5
-
6
-
7
-
8
-
9
-
10
-
11
-
12
-
13
-
14
-
15
-
16
-
17
-
18
-
19
-
20
-
21
-
22
-
23
-
24
-
25
-
26
-
27
-
28
-
29
-
30
-
31
-
32
-
33
-
34
-
35
-
36
-
37
-
38
-
39
-
40
-
41
-
42
-
43
-
44
-
45
-
46
-
47
-
48
-
49
-
50
-
51
-
52
-
53
-
54
-
55
-
56
-
57
-
58
-
59
-
60
-
61
-
62
-
63
-
64
-
65
-
66
-
67
-
68
-
69
-
70
-
71
-
72
-
73
-
74
-
75
-
76
-
77
-
78
-
79
-
80
-
81
-
82
-
83
-
84
-
85
-
86
-
87
-
88
-
89
-
90
-
91
-
92
-
93
-
94
-
95
-
96
-
97
-
98
-
99
-
100
-
101
-
102
-
103
-
104
-
105
-
106
-
107
-
108
-
109
-
110
-
111
-
112
-
113
-
114
-
115
-
116
-
117
-
118
-
119
-
120
-
121
-
122
-
123
-
124
-
125
-
126
-
127
-
128
-
129
-
130
-
131
-
132
-
133
-
134
-
135
-
136
-
137
-
138
-
139
-
140
-
141
-
142
-
143
-
144
-
145
-
146
-
147
-
148
-
149
-
150
-
151
-
152
-
153
-
154
-
155
-
156
-
157
-
158
-
159
-
160
-
161
-
162
-
163
-
164
-
165
-
166
-
167
-
168
-
169
-
170
-
171
-
172
-
173
-
174
-
175
-
176
-
177
-
178
-
179
-
180
-
181
-
182
-
183
-
184
-
185
-
186
-
187
-
188
-
189
-
190
-
191
-
 192
192 -
 193
193 -
 194
194 -
 195
195 -
 196
196 -
 197
197 -
 198
198 -
 199
199 -
 200
200 -
 201
201 -
 202
202 -
 203
203 -
 204
204 -
 205
205 -
 206
206 -
 207
207 -
 208
208 -
 209
209 -
 210
210 -
 211
211 -
 212
212 -
213
-
214
-
215
-
216
-
217
-
218
-
219
-
220
 |
 |
F124
BASEL II – PILLAR 3 DISCLOSURES (CONSOLIDATED)
movements (across curves). Currently, the scenarios provide for differential movements in each yield
curve but the movement in each curve is assumed to be parallel. Further, for the overseas operations of
the Bank, assets and liabilities are primarily linked to LIBOR and the basis risk is computed for a parallel
shift in LIBOR as well as the spread over LIBOR. The basis risk for the overall Bank is a summation of the
basis risk arising from domestic and overseas operations.
Most of the other banking entities in the Group, wherever applicable, also monitor IRRBB through similar
tools and limit framework.
Marked-to-market (MTM) on the trading book
In addition to the above, the price risk of the trading book is monitored through a framework of VaR and
cumulative stop loss limits. The management of price risk of the trading book is detailed in the Investment
Policy.
Hedging policy
Depending on the underlying asset or liability and prevailing market conditions, the Bank enters into hedge
transactions for identified assets or liabilities. The Bank has a policy for undertaking hedge transactions.
These hedges are periodically assessed for hedge effectiveness as per the applicable financial guidelines.
The hedges that meet the effectiveness requirements are accounted for on a basis similar to the underlying
asset/liability.
Frameworks in overseas banking subsidiaries
Frameworks that are broadly similar to the above framework have been established at each of the overseas
banking subsidiaries of the Bank to manage interest rate risk in the banking book. The frameworks are
established considering host country regulatory requirements as applicable.
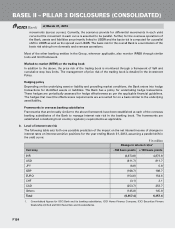
b. Level of interest rate risk
The following table sets forth one possible prediction of the impact on the net interest income of changes in
interest rates on interest sensitive positions for the year ending March 31, 2013, assuming a parallel shift in
the yield curve:
` in million
Change in interest rates1
Currency -100 basis points +100 basis points
INR (4,873.8) 4,873.8
USD (811.7) 811.7
JPY (6.8) 6.8
GBP (108.7) 108.7
EURO (154.6) 154.6
CHF (3.1) 3.1
CAD (253.7) 253.7
Others (145.0) 145.0
Total (6,357.4) 6,357.4
1. Consolidated figures for ICICI Bank and its banking subsidiaries, ICICI Home Finance Company, ICICI Securities Primary
Dealership Limited and ICICI Securities and its subsidiaries.
at March 31, 2013