ICICI Bank 2013 Annual Report Download - page 100
Download and view the complete annual report
Please find page 100 of the 2013 ICICI Bank annual report below. You can navigate through the pages in the report by either clicking on the pages listed below, or by using the keyword search tool below to find specific information within the annual report.-
 1
1 -
2
-
3
-
4
-
5
-
6
-
7
-
8
-
9
-
10
-
11
-
12
-
13
-
14
-
15
-
16
-
17
-
18
-
19
-
20
-
21
-
22
-
23
-
24
-
25
-
26
-
27
-
28
-
29
-
30
-
31
-
32
-
33
-
34
-
35
-
36
-
37
-
38
-
39
-
40
-
41
-
42
-
43
-
44
-
45
-
46
-
47
-
48
-
49
-
50
-
51
-
52
-
53
-
54
-
55
-
56
-
57
-
58
-
59
-
60
-
61
-
62
-
63
-
64
-
65
-
66
-
67
-
68
-
69
-
70
-
71
-
72
-
73
-
74
-
75
-
76
-
77
-
78
-
79
-
80
-
81
-
82
-
83
-
84
-
85
-
86
-
87
-
88
-
89
-
 90
90 -
 91
91 -
 92
92 -
 93
93 -
 94
94 -
 95
95 -
 96
96 -
 97
97 -
 98
98 -
 99
99 -
 100
100 -
 101
101 -
 102
102 -
 103
103 -
 104
104 -
 105
105 -
 106
106 -
 107
107 -
 108
108 -
 109
109 -
 110
110 -
111
-
112
-
113
-
114
-
115
-
116
-
117
-
118
-
119
-
120
-
121
-
122
-
123
-
124
-
125
-
126
-
127
-
128
-
129
-
130
-
131
-
132
-
133
-
134
-
135
-
136
-
137
-
138
-
139
-
140
-
141
-
142
-
143
-
144
-
145
-
146
-
147
-
148
-
149
-
150
-
151
-
152
-
153
-
154
-
155
-
156
-
157
-
158
-
159
-
160
-
161
-
162
-
163
-
164
-
165
-
166
-
167
-
168
-
169
-
170
-
171
-
172
-
173
-
174
-
175
-
176
-
177
-
178
-
179
-
180
-
181
-
182
-
183
-
184
-
185
-
186
-
187
-
188
-
189
-
190
-
191
-
192
-
193
-
194
-
195
-
196
-
197
-
198
-
199
-
200
-
201
-
202
-
203
-
204
-
205
-
206
-
207
-
208
-
209
-
210
-
211
-
212
-
213
-
214
-
215
-
216
-
217
-
218
-
219
-
220
 |
 |
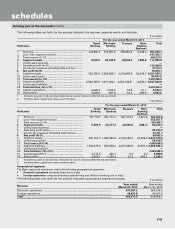
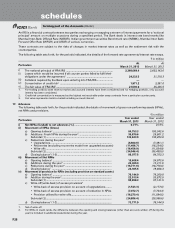
F22
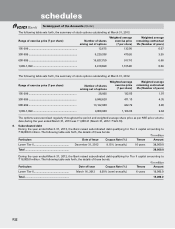
The following table sets forth, the summary of stock options outstanding at March 31, 2013.
Range of exercise price (` per share)
Number of shares
arising out of options
Weighted average
exercise price
(` per share)
Weighted average
remaining contractual
life (Number of years)
105-299 .................................................................. 12,675 132.05 0.07
300-599 .................................................................. 5,229,338 470.26 3.35
600-999 .................................................................. 16,827,750 917.10 6.66
1,000-1,399 ............................................................ 3,910,690 1,105.80 8.06
The following table sets forth, the summary of stock options outstanding at March 31, 2012.
Range of exercise price (` per share) Number of shares
arising out of options
Weighted average
exercise price
(` per share)
Weighted average
remaining contractual
life (Number of years)
105-299 ................................................................. 28,925 132.05 1.07
300-599 ................................................................. 6,048,620 471.10 4.35
600-999 ................................................................. 13,122,000 942.79 6.80
1,000-1,399 ........................................................... 4,000,000 1,106.03 9.04
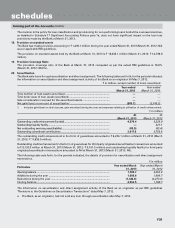
The options were exercised regularly throughout the period and weighted average share price as per NSE price volume
data during the year ended March 31, 2013 was ` 1,000.21 (March 31, 2012: ` 922.76).
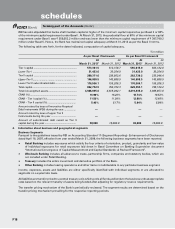
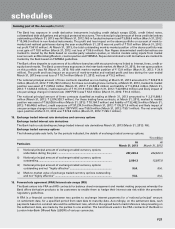
8. Subordinated debt
During the year ended March 31, 2013, the Bank raised subordinated debt qualifying for Tier II capital amounting to
` 38,000.0 million. The following table sets forth, the details of these bonds.
` in million
Particulars Date of Issue Coupon Rate (%) Tenure Amount
Lower Tier II ................................................ December 31, 2012 9.15% (annually) 10 years 38,000.0
Total ............................................................ 38,000.0
During the year ended March 31, 2012, the Bank raised subordinated debt qualifying for Tier II capital amounting to
` 16,000.0 million. The following table sets forth, the details of these bonds.
` in million
Particulars Date of Issue Coupon Rate (%) Tenure Amount
Lower Tier II ................................................ March 16, 2012 9.20% (semi-annually) 6 years 16,000.0
Total ................................................................ 16,000.0
forming part of the Accounts (Contd.)
schedules