ICICI Bank 2013 Annual Report Download - page 64
Download and view the complete annual report
Please find page 64 of the 2013 ICICI Bank annual report below. You can navigate through the pages in the report by either clicking on the pages listed below, or by using the keyword search tool below to find specific information within the annual report.-
 1
1 -
2
-
3
-
4
-
5
-
6
-
7
-
8
-
9
-
10
-
11
-
12
-
13
-
14
-
15
-
16
-
17
-
18
-
19
-
20
-
21
-
22
-
23
-
24
-
25
-
26
-
27
-
28
-
29
-
30
-
31
-
32
-
33
-
34
-
35
-
36
-
37
-
38
-
39
-
40
-
41
-
42
-
43
-
44
-
45
-
46
-
47
-
48
-
49
-
50
-
51
-
52
-
53
-
 54
54 -
 55
55 -
 56
56 -
 57
57 -
 58
58 -
 59
59 -
 60
60 -
 61
61 -
 62
62 -
 63
63 -
 64
64 -
 65
65 -
 66
66 -
 67
67 -
 68
68 -
 69
69 -
 70
70 -
 71
71 -
 72
72 -
 73
73 -
 74
74 -
75
-
76
-
77
-
78
-
79
-
80
-
81
-
82
-
83
-
84
-
85
-
86
-
87
-
88
-
89
-
90
-
91
-
92
-
93
-
94
-
95
-
96
-
97
-
98
-
99
-
100
-
101
-
102
-
103
-
104
-
105
-
106
-
107
-
108
-
109
-
110
-
111
-
112
-
113
-
114
-
115
-
116
-
117
-
118
-
119
-
120
-
121
-
122
-
123
-
124
-
125
-
126
-
127
-
128
-
129
-
130
-
131
-
132
-
133
-
134
-
135
-
136
-
137
-
138
-
139
-
140
-
141
-
142
-
143
-
144
-
145
-
146
-
147
-
148
-
149
-
150
-
151
-
152
-
153
-
154
-
155
-
156
-
157
-
158
-
159
-
160
-
161
-
162
-
163
-
164
-
165
-
166
-
167
-
168
-
169
-
170
-
171
-
172
-
173
-
174
-
175
-
176
-
177
-
178
-
179
-
180
-
181
-
182
-
183
-
184
-
185
-
186
-
187
-
188
-
189
-
190
-
191
-
192
-
193
-
194
-
195
-
196
-
197
-
198
-
199
-
200
-
201
-
202
-
203
-
204
-
205
-
206
-
207
-
208
-
209
-
210
-
211
-
212
-
213
-
214
-
215
-
216
-
217
-
218
-
219
-
220
 |
 |

62
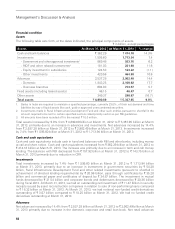
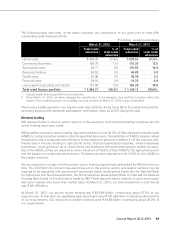
Financial condition
Assets
The following table sets forth, at the dates indicated, the principal components of assets.
` in billion, except percentages
Assets At March 31, 2012 At March 31, 2013 % change
Cash and bank balances ` 362.29 ` 414.18 14.3%
Investments 1,595.60 1,713.94 7.4
- Government and other approved investments1869.48 923.76 6.2
- RIDF and other related investments2181.03 201.98 11.6
- Equity investment in subsidiaries 124.53 123.22 (1.1)
- Other investments 420.56 464.98 10.6
Advances 2,537.28 2,902.49 14.4
- Domestic 1,843.25 2,168.92 17.7
- Overseas branches 694.03 733.57 5.7
Fixed assets (including leased assets) 46.15 46.47 0.7
Other assets 349.37 290.87 (16.7)
Total assets ` 4,890.69 ` 5,367.95 9.8%
1. Banks in India are required to maintain a specified percentage, currently 23.0%, of their net demand and time
liabilities by way of liquid assets like cash, gold or approved unencumbered securities.
2. Investments made in Rural Infrastructure Development Fund and other such entities pursuant to shortfall in the
amount required to be lent to certain specified sectors called priority sector as per RBI guidelines.
3. All amounts have been rounded off to the nearest ` 10.0 million.
Total assets increased by 9.8% from ` 4,890.69 billion at March 31, 2012 to ` 5,367.95 billion at March
31, 2013, primarily due to an increase in advances and investments. Net advances increased by 14.4%
from ` 2,537.28 billion at March 31, 2012 to ` 2,902.49 billion at March 31, 2013. Investments increased
by 7.4% from ` 1,595.60 billion at March 31, 2012 to ` 1,713.94 billion at March 31, 2013.
Cash and cash equivalents
Cash and cash equivalents include cash in hand and balances with RBI and other banks, including money
at call and short notice. Cash and cash equivalents increased from ` 362.29 billion at March 31, 2012 to
` 414.18 billion at March 31, 2013. The increase was primarily due to an increase in term and call money
lending. The balances with RBI decreased from ` 157.92 billion at March 31, 2012 to ` 143.75 billion at
March 31, 2013 primarily due to reduction in CRR.
Investments
Total investments increased by 7.4% from ` 1,595.60 billion at March 31, 2012 to ` 1,713.94 billion
at March 31, 2013, primarily due to an increase in investment in government securities by ` 54.28
billion, Rural Infrastructure Development Fund and other related investments (pursuant to shortfall in
achievement of directed lending requirements) by ` 20.96 billion, pass through certificates by ` 35.20
billion and commercial paper and certificates of deposit by ` 34.87 billion. The investment in mutual
funds decreased by ` 21.54 billion and corporate bonds and debentures decreased by ` 20.36 billion
during fiscal 2013. At March 31, 2013, we had an outstanding net investment of ` 11.47 billion in security
receipts issued by asset reconstruction companies in relation to sale of non-performing loans compared
to ` 18.32 billion at March 31, 2012. At March 31, 2013, we had notional non-funded credit derivatives
outstanding of ` 3.07 billion compared to ` 10.25 billion at March 31, 2012. We had no funded credit
derivatives outstanding at March 31, 2013.
Advances
Net advances increased by 14.4% from ` 2,537.28 billion at March 31, 2012 to ` 2,902.49 billion at March
31, 2013 primarily due to increase in the domestic corporate and retail loan book. Net retail advances
Management’s Discussion & Analysis