ICICI Bank 2013 Annual Report Download - page 185
Download and view the complete annual report
Please find page 185 of the 2013 ICICI Bank annual report below. You can navigate through the pages in the report by either clicking on the pages listed below, or by using the keyword search tool below to find specific information within the annual report.-
 1
1 -
2
-
3
-
4
-
5
-
6
-
7
-
8
-
9
-
10
-
11
-
12
-
13
-
14
-
15
-
16
-
17
-
18
-
19
-
20
-
21
-
22
-
23
-
24
-
25
-
26
-
27
-
28
-
29
-
30
-
31
-
32
-
33
-
34
-
35
-
36
-
37
-
38
-
39
-
40
-
41
-
42
-
43
-
44
-
45
-
46
-
47
-
48
-
49
-
50
-
51
-
52
-
53
-
54
-
55
-
56
-
57
-
58
-
59
-
60
-
61
-
62
-
63
-
64
-
65
-
66
-
67
-
68
-
69
-
70
-
71
-
72
-
73
-
74
-
75
-
76
-
77
-
78
-
79
-
80
-
81
-
82
-
83
-
84
-
85
-
86
-
87
-
88
-
89
-
90
-
91
-
92
-
93
-
94
-
95
-
96
-
97
-
98
-
99
-
100
-
101
-
102
-
103
-
104
-
105
-
106
-
107
-
108
-
109
-
110
-
111
-
112
-
113
-
114
-
115
-
116
-
117
-
118
-
119
-
120
-
121
-
122
-
123
-
124
-
125
-
126
-
127
-
128
-
129
-
130
-
131
-
132
-
133
-
134
-
135
-
136
-
137
-
138
-
139
-
140
-
141
-
142
-
143
-
144
-
145
-
146
-
147
-
148
-
149
-
150
-
151
-
152
-
153
-
154
-
155
-
156
-
157
-
158
-
159
-
160
-
161
-
162
-
163
-
164
-
165
-
166
-
167
-
168
-
169
-
170
-
171
-
172
-
173
-
174
-
 175
175 -
 176
176 -
 177
177 -
 178
178 -
 179
179 -
 180
180 -
 181
181 -
 182
182 -
 183
183 -
 184
184 -
 185
185 -
 186
186 -
 187
187 -
 188
188 -
 189
189 -
 190
190 -
 191
191 -
 192
192 -
 193
193 -
 194
194 -
 195
195 -
196
-
197
-
198
-
199
-
200
-
201
-
202
-
203
-
204
-
205
-
206
-
207
-
208
-
209
-
210
-
211
-
212
-
213
-
214
-
215
-
216
-
217
-
218
-
219
-
220
 |
 |

F107
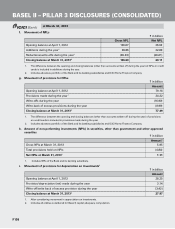
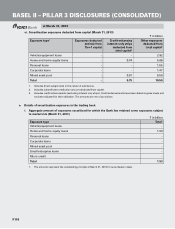
d. Maturity pattern of assets (March 31, 2013)1
The maturity pattern of assets at March 31, 2013 is detailed in the table below:
` in billion
Maturity buckets Cash &
balances
with RBI
Balances
with banks
& money
at call and
short notice
Investments Loans &
advances
Fixed
assets
Other
assets
Total
Day 1 64.00 64.25 150.12 9.52 - 9.53 297.42
2 to 7 days 4.55 103.40 235.61 17.93 (0.00) 29.20 390.69
8 to 14 days 3.70 55.89 75.24 43.30 - 16.95 195.09
15 to 28 days 4.15 11.56 134.43 60.65 - 35.16 245.95
29 days to 3
months
11.49 15.46 103.90 213.91 0.02 10.02 354.79
3 to 6 months 10.55 18.59 80.03 227.86 0.00 12.91 349.94
6 months to 1 year 18.51 1.57 160.57 361.05 0.00 2.48 544.19
1 to 3 years 18.16 0.88 242.74 1,305.94 2.38 0.85 1,570.95
3 to 5 years 23.16 0.00 231.13 606.65 0.06 0.18 861.18
Above 5 years 32.62 0.01 353.78 452.71 45.46 177.00 1,061.52
Total 190.88 271.61 1,767.54 3,299.51 47.93 294.30 5,871.77
1. Consolidated figures for the Bank and its banking subsidiaries, ICICI Home Finance Company, ICICI Securities Primary
Dealership Limited and ICICI Securities Limited and its subsidiaries. The maturity pattern of assets for the Bank is based on
methodology used for reporting positions to the RBI on asset-liability management. The maturity pattern of assets for the
subsidiaries is based on similar principles.
e. Amount of non-performing loans (NPLs) (March 31, 2013)
` in billion
NPL classification Gross NPLs Net NPLs
Sub-standard 22.47 17.27
Doubtful 73.70 11.82
- Doubtful 11 20.66 8.16
- Doubtful 21 34.03 3.42
- Doubtful 31 19.01 0.24
Loss 10.43 0.02
Total2, 3 106.60 29.11
NPL ratio43.13% 0.88%
1. Loans classified as NPLs for 456-820 days are classified as Doubtful 1, 821-1,550 days as Doubtful 2 and above 1,550 days
as Doubtful 3.
2. Identification of loans as non-performing/impaired is in line with the guidelines issued by regulators of respective subsidiaries.
3. Includes advances portfolio of the Bank and its banking subsidiaries and ICICI Home Finance Company.
4. Gross NPL ratio is computed as a ratio of gross NPLs to gross advances. Net NPL ratio is computed as a ratio of net NPLs to
net advances.
BASEL II – PILLAR 3 DISCLOSURES (CONSOLIDATED)
at March 31, 2013