ICICI Bank 2013 Annual Report Download - page 106
Download and view the complete annual report
Please find page 106 of the 2013 ICICI Bank annual report below. You can navigate through the pages in the report by either clicking on the pages listed below, or by using the keyword search tool below to find specific information within the annual report.-
 1
1 -
2
-
3
-
4
-
5
-
6
-
7
-
8
-
9
-
10
-
11
-
12
-
13
-
14
-
15
-
16
-
17
-
18
-
19
-
20
-
21
-
22
-
23
-
24
-
25
-
26
-
27
-
28
-
29
-
30
-
31
-
32
-
33
-
34
-
35
-
36
-
37
-
38
-
39
-
40
-
41
-
42
-
43
-
44
-
45
-
46
-
47
-
48
-
49
-
50
-
51
-
52
-
53
-
54
-
55
-
56
-
57
-
58
-
59
-
60
-
61
-
62
-
63
-
64
-
65
-
66
-
67
-
68
-
69
-
70
-
71
-
72
-
73
-
74
-
75
-
76
-
77
-
78
-
79
-
80
-
81
-
82
-
83
-
84
-
85
-
86
-
87
-
88
-
89
-
90
-
91
-
92
-
93
-
94
-
95
-
 96
96 -
 97
97 -
 98
98 -
 99
99 -
 100
100 -
 101
101 -
 102
102 -
 103
103 -
 104
104 -
 105
105 -
 106
106 -
 107
107 -
 108
108 -
 109
109 -
 110
110 -
 111
111 -
 112
112 -
 113
113 -
 114
114 -
 115
115 -
 116
116 -
117
-
118
-
119
-
120
-
121
-
122
-
123
-
124
-
125
-
126
-
127
-
128
-
129
-
130
-
131
-
132
-
133
-
134
-
135
-
136
-
137
-
138
-
139
-
140
-
141
-
142
-
143
-
144
-
145
-
146
-
147
-
148
-
149
-
150
-
151
-
152
-
153
-
154
-
155
-
156
-
157
-
158
-
159
-
160
-
161
-
162
-
163
-
164
-
165
-
166
-
167
-
168
-
169
-
170
-
171
-
172
-
173
-
174
-
175
-
176
-
177
-
178
-
179
-
180
-
181
-
182
-
183
-
184
-
185
-
186
-
187
-
188
-
189
-
190
-
191
-
192
-
193
-
194
-
195
-
196
-
197
-
198
-
199
-
200
-
201
-
202
-
203
-
204
-
205
-
206
-
207
-
208
-
209
-
210
-
211
-
212
-
213
-
214
-
215
-
216
-
217
-
218
-
219
-
220
 |
 |

F28
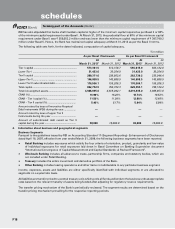
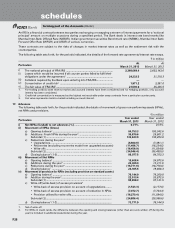
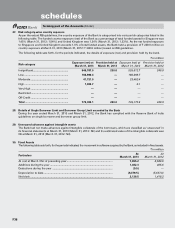
An IRS is a financial contract between two parties exchanging or swapping a stream of interest payments for a ’notional
principal’ amount on multiple occasions during a specified period. The Bank deals in interest rate benchmarks like
Mumbai Inter-Bank Offered Rate (MIBOR), Indian government securities Benchmark rate (INBMK), Mumbai Inter Bank
Forward Offer Rate (MIFOR) and LIBOR of various currencies.
These contracts are subject to the risks of changes in market interest rates as well as the settlement risk with the
counterparties.
The following table sets forth, for the periods indicated, the details of the forward rate agreements/interest rate swaps.
` in million
Particulars At
March 31, 2013
At
March 31, 2012
i) The notional principal of FRA/IRS ................................................................ 2,368,069.4 2,603,143.0
ii) Losses which would be incurred if all counter parties failed to fulfil their
obligations under the agreement1 ............................................................... 24,232.5 31,219.3
iii) Collateral required by the Bank upon entering into FRA/IRS ...................... ——
iv) Concentration of credit risk2 ........................................................................ 1,971.2 3,261.6
v) The fair value of FRA/IRS3 ............................................................................. 21,530.0 25,235.5
1. For trading portfolio both mark-to-market and accrued interest have been considered and for hedging portfolio, only accrued
interest has been considered.
2. Credit risk concentration is measured as the highest net receivable under swap contracts from a particular counter party.
3. Fair value represents mark-to-market including accrued interest.
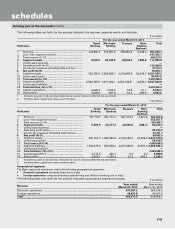
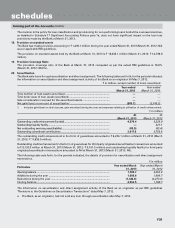
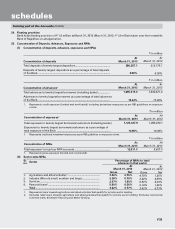
17. Advances
The following table sets forth, for the periods indicated, the details of movement of gross non-performing assets (NPAs),
net NPAs and provisions.
` in million
Particulars Year ended
March 31, 2013
Year ended
March 31, 2012
i) Net NPAs (funded) to net advances (%) ................................................... 0.77% 0.73%
ii) Movement of NPAs (Gross)
a) Opening balance1 ................................................................................ 94,753.3 100,342.6
b) Additions: Fresh NPAs during the year2 ................................................ 35,870.6 29,861.2
Sub-total (1) ......................................................................................... 130,623.9 130,203.8
c) Reductions during the year2
•Upgradations ................................................................................... (6,600.8) (7,381.1)
•Recoveries(excludingrecoveriesmadefromupgradedaccounts) (11,486.7) (16,234.5)
•Write-offs ......................................................................................... (16,458.9) (11,834.9)
Sub-total (2) ............................................................................................... (34,546.4) (35,450.5)
d) Closing balance1 (1-2) .......................................................................... 96,077.5 94,753.3
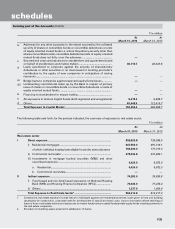
iii) Movement of Net NPAs
a) Opening balance1 ................................................................................ 18,608.4 24,073.6
b) Additions during the year2 .................................................................. 20,469.0 13,311.6
c) Reductions during the year2 ............................................................... (16,771.8) (18,776.8)
d) Closing balance1 ................................................................................. 22,305.6 18,608.4
iv) Movement of provision for NPAs (excluding provision on standard assets)
a) Opening balance1 ................................................................................ 76,144.9 76,269.0
b) Addition during the year2 .................................................................... 22,513.4 20,872.5
Sub-total (1) ......................................................................................... 98,658.3 97,141.5
c) Write-off/(write-back) of excess provisions2
•Write-backofexcessprovisiononaccountofupgradations ........ (1,543.3) (2,177.8)
•Write-backofexcessprovisiononaccountofreductioninNPAs (7,072.7) (7,724.3)
•Provisionutilisedforwrite-offs ....................................................... (16,270.4) (11,094.5)
Sub-total (2) ......................................................................................... (24,886.4) (20,996.6)
d) Closing balance1 (1-2) .......................................................................... 73,771.9 76,144.9
1. Net of write-off.
2. For NPAs in credit cards, the difference between the opening and closing balances (other than accounts written off during the
year) is included in additions/(reductions) during the year.
forming part of the Accounts (Contd.)
schedules