ICICI Bank 2013 Annual Report Download - page 55
Download and view the complete annual report
Please find page 55 of the 2013 ICICI Bank annual report below. You can navigate through the pages in the report by either clicking on the pages listed below, or by using the keyword search tool below to find specific information within the annual report.-
 1
1 -
2
-
3
-
4
-
5
-
6
-
7
-
8
-
9
-
10
-
11
-
12
-
13
-
14
-
15
-
16
-
17
-
18
-
19
-
20
-
21
-
22
-
23
-
24
-
25
-
26
-
27
-
28
-
29
-
30
-
31
-
32
-
33
-
34
-
35
-
36
-
37
-
38
-
39
-
40
-
41
-
42
-
43
-
44
-
 45
45 -
 46
46 -
 47
47 -
 48
48 -
 49
49 -
 50
50 -
 51
51 -
 52
52 -
 53
53 -
 54
54 -
 55
55 -
 56
56 -
 57
57 -
 58
58 -
 59
59 -
 60
60 -
 61
61 -
 62
62 -
 63
63 -
 64
64 -
 65
65 -
66
-
67
-
68
-
69
-
70
-
71
-
72
-
73
-
74
-
75
-
76
-
77
-
78
-
79
-
80
-
81
-
82
-
83
-
84
-
85
-
86
-
87
-
88
-
89
-
90
-
91
-
92
-
93
-
94
-
95
-
96
-
97
-
98
-
99
-
100
-
101
-
102
-
103
-
104
-
105
-
106
-
107
-
108
-
109
-
110
-
111
-
112
-
113
-
114
-
115
-
116
-
117
-
118
-
119
-
120
-
121
-
122
-
123
-
124
-
125
-
126
-
127
-
128
-
129
-
130
-
131
-
132
-
133
-
134
-
135
-
136
-
137
-
138
-
139
-
140
-
141
-
142
-
143
-
144
-
145
-
146
-
147
-
148
-
149
-
150
-
151
-
152
-
153
-
154
-
155
-
156
-
157
-
158
-
159
-
160
-
161
-
162
-
163
-
164
-
165
-
166
-
167
-
168
-
169
-
170
-
171
-
172
-
173
-
174
-
175
-
176
-
177
-
178
-
179
-
180
-
181
-
182
-
183
-
184
-
185
-
186
-
187
-
188
-
189
-
190
-
191
-
192
-
193
-
194
-
195
-
196
-
197
-
198
-
199
-
200
-
201
-
202
-
203
-
204
-
205
-
206
-
207
-
208
-
209
-
210
-
211
-
212
-
213
-
214
-
215
-
216
-
217
-
218
-
219
-
220
 |
 |

Annual Report 2012-2013 53
direct investment in multi-brand retail, formation of the Cabinet Committee on Investments to expedite
investments in projects, partial deregulation of diesel prices, increase in petrol prices and railway
passenger fares and deferral of General Anti Avoidance Rules (GAAR) implementation to fiscal 2017.
These announcements had a positive impact on market sentiment.
The Indian equity markets improved due to favourable global liquidity conditions and domestic events.
The extraordinary liquidity support announced by the US, EU and Japan had a positive impact on global
financial markets. This was further supported by gradual improvement in US economic indicators. The
benchmark equity index, the BSE Sensex, increased by 8.2% during fiscal 2013, rising from 17,404 at
March 31, 2012 to a peak of 20,104 at January 25, 2013, before moderating to 18,835 at March 28, 2013.
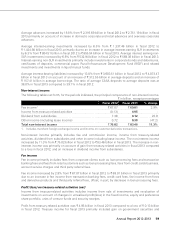
Foreign institutional investment (FII) flows were significantly higher during the year, with net inflows of
USD 29.00 billion during fiscal 2013 compared to USD 16.81 billion inflows during fiscal 2012. Foreign
direct investments moderated to USD 21.10 billion and external commercial borrowings to USD 4.72
billion during the first nine months of fiscal 2013 compared to USD 28.74 billion and USD 6.89 billion
respectively during the corresponding period of fiscal 2012. During the first nine months of fiscal 2013, a
steeper decline in India’s exports compared to imports led to a rise in the current account deficit to 5.3% of
GDP. However, India’s balance of payments had a marginal surplus of USD 1.15 billion during the first nine
months of fiscal 2013 as against a deficit of USD 7.09 billion during the corresponding period of fiscal 2012,
reflecting strong portfolio investment inflows. The rupee depreciated by 6.3% against the US dollar from
` 51.16 per US dollar at March 30, 2012 to ` 54.39 per US dollar at March 28, 2013.
Non-food credit growth moderated during fiscal 2013 from 16.8% at March 23, 2012 to 14.0% at March
22, 2013. Based on sector-wise data, year-on-year growth in credit to industry was 15.7% and to the
services sector was 13.6% at March 22, 2013. Credit to the infrastructure sector grew by 16.5% year-on-
year at March 22, 2013 compared to an 20.5% increase at March 23, 2012 and a 37.8% increase at March
25, 2011. Retail loan growth increased to 14.5% year-on-year at March 22, 2013 compared to 12.9% at
March 23, 2012. Deposit growth remained muted during the year recording year-on-year growth of 14.3%
at March 22, 2013 compared to 13.5% growth at March 23, 2012. Demand deposit growth was 5.9%
year-on-year at March 22, 2013.
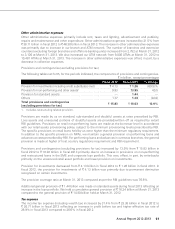
First year retail premium underwritten in the life insurance sector increased (on weighted received
premium basis) to ` 389.56 billion in fiscal 2013 from ` 382.54 billion in fiscal 2012. Gross premium of
the non-life insurance sector (excluding specialised insurance institutions) grew by 18.4% to ` 647.07
billion during fiscal 2013 from ` 546.45 billion during fiscal 2012. The average assets under management
of mutual funds increased by 22.8% from ` 6,647.92 billion in March 2012 to ` 8,166.57 billion in March
2013.
Some key regulatory developments in the Indian financial sector during fiscal 2013 include:
• In May 2012, RBI’s final guidelines on implementation of Basel III capital regulations were released.
These guidelines require, among other things, higher levels of Tier-1 capital and common equity,
capital conservation buffers, higher deductions from common equity and Tier-1 capital for investments
in subsidiaries and changes in the structure of non-equity instruments eligible for inclusion in Tier-1
capital. The guidelines are to be fully implemented by March 2018. While the initial date for commencing
implementation was January 1, 2013, it was later deferred to April 1, 2013.