ICICI Bank 2013 Annual Report Download - page 34
Download and view the complete annual report
Please find page 34 of the 2013 ICICI Bank annual report below. You can navigate through the pages in the report by either clicking on the pages listed below, or by using the keyword search tool below to find specific information within the annual report.-
 1
1 -
2
-
3
-
4
-
5
-
6
-
7
-
8
-
9
-
10
-
11
-
12
-
13
-
14
-
15
-
16
-
17
-
18
-
19
-
20
-
21
-
22
-
23
-
 24
24 -
 25
25 -
 26
26 -
 27
27 -
 28
28 -
 29
29 -
 30
30 -
 31
31 -
 32
32 -
 33
33 -
 34
34 -
 35
35 -
 36
36 -
 37
37 -
 38
38 -
 39
39 -
 40
40 -
 41
41 -
 42
42 -
 43
43 -
 44
44 -
45
-
46
-
47
-
48
-
49
-
50
-
51
-
52
-
53
-
54
-
55
-
56
-
57
-
58
-
59
-
60
-
61
-
62
-
63
-
64
-
65
-
66
-
67
-
68
-
69
-
70
-
71
-
72
-
73
-
74
-
75
-
76
-
77
-
78
-
79
-
80
-
81
-
82
-
83
-
84
-
85
-
86
-
87
-
88
-
89
-
90
-
91
-
92
-
93
-
94
-
95
-
96
-
97
-
98
-
99
-
100
-
101
-
102
-
103
-
104
-
105
-
106
-
107
-
108
-
109
-
110
-
111
-
112
-
113
-
114
-
115
-
116
-
117
-
118
-
119
-
120
-
121
-
122
-
123
-
124
-
125
-
126
-
127
-
128
-
129
-
130
-
131
-
132
-
133
-
134
-
135
-
136
-
137
-
138
-
139
-
140
-
141
-
142
-
143
-
144
-
145
-
146
-
147
-
148
-
149
-
150
-
151
-
152
-
153
-
154
-
155
-
156
-
157
-
158
-
159
-
160
-
161
-
162
-
163
-
164
-
165
-
166
-
167
-
168
-
169
-
170
-
171
-
172
-
173
-
174
-
175
-
176
-
177
-
178
-
179
-
180
-
181
-
182
-
183
-
184
-
185
-
186
-
187
-
188
-
189
-
190
-
191
-
192
-
193
-
194
-
195
-
196
-
197
-
198
-
199
-
200
-
201
-
202
-
203
-
204
-
205
-
206
-
207
-
208
-
209
-
210
-
211
-
212
-
213
-
214
-
215
-
216
-
217
-
218
-
219
-
220
 |
 |

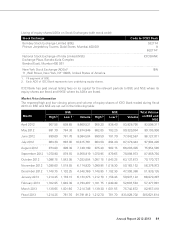
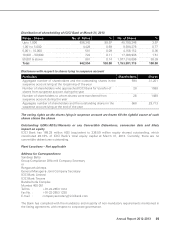
32
The reported high and low closing prices and volume of ADSs of ICICI Bank traded during fiscal 2013 on
the NYSE are given below:
Month High (US$) Low (US$) Number of ADS traded
April 2012 35.80 32.26 36,261,627
May 2012 34.07 28.15 47,197,186
June 2012 32.41 27.99 41,617,543
July 2012 35.25 32.40 34,877,257
August 2012 35.49 32.53 26,974,592
September 2012 40.15 32.34 39,855,709
October 2012 41.90 39.25 25,925,051
November 2012 41.54 37.36 26,390,992
December 2012 44.91 41.14 24,599,523
January 2013 46.98 43.94 23,279,468
February 2013 47.76 41.71 28,062,865
March 2013 45.15 40.12 26,874,610
Fiscal 2013 47.76 27.99 381,916,423
The performance of the ICICI Bank equity share relative to the S&P BSE Sensitive Index (Sensex), S&P BSE
Bank Index (Bankex) and NYSE Financial Index during the period April 1, 2012 to March 31, 2013 is given
in the following chart:
140.00
130.00
120.00
110.00
100.00
90.00
80.00
Apr - 12
May - 12
Jun - 12
Jul - 12
Aug - 12
Sep - 12
Oct - 12
Nov - 12
Dec - 12
Jan - 13
Feb - 13
Mar - 13
Sensex Bankex NYSE Financial Index ICICI Bank
Directors’ Report