ICICI Bank 2013 Annual Report Download - page 136
Download and view the complete annual report
Please find page 136 of the 2013 ICICI Bank annual report below. You can navigate through the pages in the report by either clicking on the pages listed below, or by using the keyword search tool below to find specific information within the annual report.-
 1
1 -
2
-
3
-
4
-
5
-
6
-
7
-
8
-
9
-
10
-
11
-
12
-
13
-
14
-
15
-
16
-
17
-
18
-
19
-
20
-
21
-
22
-
23
-
24
-
25
-
26
-
27
-
28
-
29
-
30
-
31
-
32
-
33
-
34
-
35
-
36
-
37
-
38
-
39
-
40
-
41
-
42
-
43
-
44
-
45
-
46
-
47
-
48
-
49
-
50
-
51
-
52
-
53
-
54
-
55
-
56
-
57
-
58
-
59
-
60
-
61
-
62
-
63
-
64
-
65
-
66
-
67
-
68
-
69
-
70
-
71
-
72
-
73
-
74
-
75
-
76
-
77
-
78
-
79
-
80
-
81
-
82
-
83
-
84
-
85
-
86
-
87
-
88
-
89
-
90
-
91
-
92
-
93
-
94
-
95
-
96
-
97
-
98
-
99
-
100
-
101
-
102
-
103
-
104
-
105
-
106
-
107
-
108
-
109
-
110
-
111
-
112
-
113
-
114
-
115
-
116
-
117
-
118
-
119
-
120
-
121
-
122
-
123
-
124
-
125
-
 126
126 -
 127
127 -
 128
128 -
 129
129 -
 130
130 -
 131
131 -
 132
132 -
 133
133 -
 134
134 -
 135
135 -
 136
136 -
 137
137 -
 138
138 -
 139
139 -
 140
140 -
 141
141 -
 142
142 -
 143
143 -
 144
144 -
 145
145 -
 146
146 -
147
-
148
-
149
-
150
-
151
-
152
-
153
-
154
-
155
-
156
-
157
-
158
-
159
-
160
-
161
-
162
-
163
-
164
-
165
-
166
-
167
-
168
-
169
-
170
-
171
-
172
-
173
-
174
-
175
-
176
-
177
-
178
-
179
-
180
-
181
-
182
-
183
-
184
-
185
-
186
-
187
-
188
-
189
-
190
-
191
-
192
-
193
-
194
-
195
-
196
-
197
-
198
-
199
-
200
-
201
-
202
-
203
-
204
-
205
-
206
-
207
-
208
-
209
-
210
-
211
-
212
-
213
-
214
-
215
-
216
-
217
-
218
-
219
-
220
 |
 |

F58
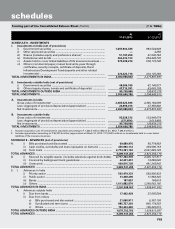
for the year ended March 31, 2013 (` in ‘000s)
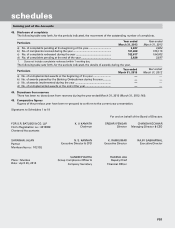
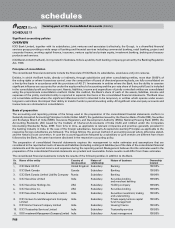
Significant accounting policies and notes to accounts (refer schedule 17 & 18).
Refer item no. 12 in schedule 17 significant accounting policies.
The schedules referred to above form an integral part of the Balance Sheet.
As per our Report of even date. For and on behalf of the Board of Directors
For S.R. BATLIBOI & CO. LLP
Firm’s Registration no.: 301003E
Chartered Accountants
K. V. KAMATH SRIDAR IYENGAR CHANDA KOCHHAR
Chairman Director Managing Director & CEO
SHRAWAN JALAN
Partner
Membership no.: 102102
N. S. KANNAN K. RAMKUMAR RAJIV SABHARWAL
Executive Director & CFO Executive Director Executive Director
SANDEEP BATRA RAKESH JHA
Place : Mumbai Group Compliance Officer &
Company Secretary
Deputy Chief
Financial Officer
Date : April 26, 2013
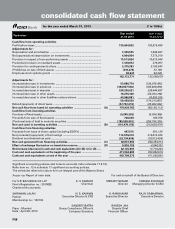
consolidated cash flow statement
Particulars Year ended
31.03.2013
Year ended
31.03.2012
Cash flow from operating activities
Profit before taxes .......................................................................................... 130,904,932 103,919,499
Adjustments for :
Depreciation and amortisation .................................................................... 7,309,535 7,546,097
Net (appreciation)/depreciation on investments ......................................... 4,964,954 7,773,019
Provision in respect of non-performing assets ............................................ 15,513,824 10,510,044
Prudential provision on standard assets ...................................................... 1,349,872 279,057
Provision for contingencies & others ............................................................ 2,370,283 2,100,543
(Profit)/loss on sale of fixed assets ............................................................... (339,276) 37,180
Employee stock options grants .................................................................... 98,647 93,240
162,172,771 132,258,679
Adjustments for :
(Increase)/decrease in investments .............................................................. 53,888,779 (126,076,483)
(Increase)/decrease in advances .................................................................. (394,857,560) (335,829,069)
Increase/(decrease) in deposits .................................................................... 328,200,621 228,444,687
(Increase)/decrease in other assets .............................................................. 19,276,308 (24,703,198)
Increase/(decrease) in other liabilities and provisions ................................ 43,960,881 83,850,256
50,469,029 (174,313,807)
Refund/(payment) of direct taxes ................................................................. (37,702,018) (26,082,984)
Net cash flow from/(used in) operating activities ..................................... (A) 174,939,782 (68,138,112)
Cash flow from investing activities
Purchase of fixed assets ................................................................................ (6,249,292) (6,054,398)
Proceeds from sale of fixed assets ............................................................... 700,038 180,758
(Purchase)/sale of held to maturity securities .............................................. (185,928,901) (206,755,330)
Net cash used in investing activities ........................................................... (B) (191,478,155) (212,628,970)
Cash flow from financing activities
Proceeds from issue of share capital (including ESOPs) ............................. 447,515 591,128
Net proceeds/(repayment) of borrowings .................................................... 114,579,019 312,815,320
Dividend and dividend tax paid .................................................................... (22,194,629) (19,013,434)
Net cash generated from financing activities.............................................. (C) 92,831,905 294,393,014
Effect of exchange fluctuation on translation reserve ................................ (D) 5,852,155 4,084,332
Net increase/(decrease) in cash and cash equivalents (A)+(B)+(C)+(D) ...... 82,145,687 17,710,264
Cash and cash equivalents at the beginning of the year .......................... 411,562,883 393,852,619
Cash and cash equivalents at end of the year ........................................... 493,708,570 411,562,883