ICICI Bank 2013 Annual Report Download - page 157
Download and view the complete annual report
Please find page 157 of the 2013 ICICI Bank annual report below. You can navigate through the pages in the report by either clicking on the pages listed below, or by using the keyword search tool below to find specific information within the annual report.-
 1
1 -
2
-
3
-
4
-
5
-
6
-
7
-
8
-
9
-
10
-
11
-
12
-
13
-
14
-
15
-
16
-
17
-
18
-
19
-
20
-
21
-
22
-
23
-
24
-
25
-
26
-
27
-
28
-
29
-
30
-
31
-
32
-
33
-
34
-
35
-
36
-
37
-
38
-
39
-
40
-
41
-
42
-
43
-
44
-
45
-
46
-
47
-
48
-
49
-
50
-
51
-
52
-
53
-
54
-
55
-
56
-
57
-
58
-
59
-
60
-
61
-
62
-
63
-
64
-
65
-
66
-
67
-
68
-
69
-
70
-
71
-
72
-
73
-
74
-
75
-
76
-
77
-
78
-
79
-
80
-
81
-
82
-
83
-
84
-
85
-
86
-
87
-
88
-
89
-
90
-
91
-
92
-
93
-
94
-
95
-
96
-
97
-
98
-
99
-
100
-
101
-
102
-
103
-
104
-
105
-
106
-
107
-
108
-
109
-
110
-
111
-
112
-
113
-
114
-
115
-
116
-
117
-
118
-
119
-
120
-
121
-
122
-
123
-
124
-
125
-
126
-
127
-
128
-
129
-
130
-
131
-
132
-
133
-
134
-
135
-
136
-
137
-
138
-
139
-
140
-
141
-
142
-
143
-
144
-
145
-
146
-
 147
147 -
 148
148 -
 149
149 -
 150
150 -
 151
151 -
 152
152 -
 153
153 -
 154
154 -
 155
155 -
 156
156 -
 157
157 -
 158
158 -
 159
159 -
 160
160 -
 161
161 -
 162
162 -
 163
163 -
 164
164 -
 165
165 -
 166
166 -
 167
167 -
168
-
169
-
170
-
171
-
172
-
173
-
174
-
175
-
176
-
177
-
178
-
179
-
180
-
181
-
182
-
183
-
184
-
185
-
186
-
187
-
188
-
189
-
190
-
191
-
192
-
193
-
194
-
195
-
196
-
197
-
198
-
199
-
200
-
201
-
202
-
203
-
204
-
205
-
206
-
207
-
208
-
209
-
210
-
211
-
212
-
213
-
214
-
215
-
216
-
217
-
218
-
219
-
220
 |
 |

F79
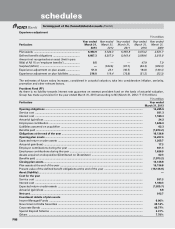
forming part of the Consolidated Accounts (Contd.)
schedules
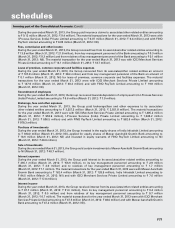
The following table sets forth, for the periods indicated, the balance payable to/receivable from relatives of key
management personnel:
` in million
Items At
March 31, 2013
At
March 31, 2012
Deposits .............................................................................................................. 23.6 19.8
Advances ............................................................................................................ 6.9 7.4
The following table sets forth, for the periods indicated, the maximum balance payable to/receivable from key
management personnel:
` in million
Items Year ended
March 31, 2013
Year ended
March 31, 2012
Deposits ............................................................................................................. 74.3 64.0
Advances .......................................................................................................... 10.4 10.7
Investments ....................................................................................................... 4.1 4.1
1. Maximum balances are determined based on comparison of the total outstanding balances at each quarter end during the
financial year.
The following table sets forth, for the periods indicated, the maximum balance payable to/receivable from relatives of
key management personnel:
` in million
Items Year ended
March 31, 2013
Year ended
March 31, 2012
Deposits ............................................................................................................. 44.6 29.3
Advances ........................................................................................................... 7.9 9.2
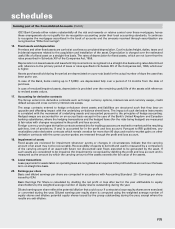
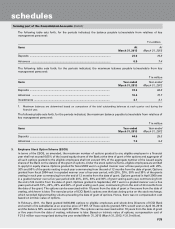
3. Employee Stock Option Scheme (ESOS)
In terms of the ESOS, as amended, the maximum number of options granted to any eligible employee in a financial
year shall not exceed 0.05% of the issued equity shares of the Bank at the time of grant of the options and aggregate of
all such options granted to the eligible employees shall not exceed 10% of the aggregate number of the issued equity
shares of the Bank on the date(s) of the grant of options. Under the stock option scheme, eligible employees are entitled
to apply for equity shares. Options granted for fiscal 2003 vest in a graded manner over a three-year period, with 20%,
30% and 50% of the grants vesting in each year commencing from the end of 12 months from the date of grant. Options
granted from fiscal 2004 vest in a graded manner over a four-year period, with 20%, 20%, 30% and 30% of the grants
vesting in each year commencing from the end of 12 months from the date of grant. Options granted in April 2009 vest
in a graded manner over a five year period with 20%, 20%, 30% and 30% of grant vesting each year, commencing from
the end of 24 months from the date of grant. Options granted in September, 2011 vest in a graded manner over a five
years period with 15%, 20%, 20% and 45% of grant vesting each year, commencing from the end of 24 months from
the date of the grant. The options can be exercised within 10 years from the date of grant or five years from the date of
vesting, whichever is later. The exercise price of ICICI Bank’s options was the last closing price on the stock exchange,
which recorded highest trading volume preceding the date of grant of options. Hence, there was no compensation cost
based on intrinsic value of options.
In February, 2011, the Bank granted 3,035,000 options to eligible employees and whole-time Directors of ICICI Bank
and certain of its subsidiaries at an exercise price of ` 967. Of these options granted, 50% would vest on April 30, 2014
and the balance 50% would vest on April 30, 2015. The options can be exercised within 10 years from the date of grant
or five years from the date of vesting, whichever is later. Based on intrinsic value of options, compensation cost of
` 21.0 million was recognised during the year ended March 31, 2013 (March 31, 2012: ` 21.0 million).