ICICI Bank 2013 Annual Report Download - page 60
Download and view the complete annual report
Please find page 60 of the 2013 ICICI Bank annual report below. You can navigate through the pages in the report by either clicking on the pages listed below, or by using the keyword search tool below to find specific information within the annual report.-
 1
1 -
2
-
3
-
4
-
5
-
6
-
7
-
8
-
9
-
10
-
11
-
12
-
13
-
14
-
15
-
16
-
17
-
18
-
19
-
20
-
21
-
22
-
23
-
24
-
25
-
26
-
27
-
28
-
29
-
30
-
31
-
32
-
33
-
34
-
35
-
36
-
37
-
38
-
39
-
40
-
41
-
42
-
43
-
44
-
45
-
46
-
47
-
48
-
49
-
 50
50 -
 51
51 -
 52
52 -
 53
53 -
 54
54 -
 55
55 -
 56
56 -
 57
57 -
 58
58 -
 59
59 -
 60
60 -
 61
61 -
 62
62 -
 63
63 -
 64
64 -
 65
65 -
 66
66 -
 67
67 -
 68
68 -
 69
69 -
 70
70 -
71
-
72
-
73
-
74
-
75
-
76
-
77
-
78
-
79
-
80
-
81
-
82
-
83
-
84
-
85
-
86
-
87
-
88
-
89
-
90
-
91
-
92
-
93
-
94
-
95
-
96
-
97
-
98
-
99
-
100
-
101
-
102
-
103
-
104
-
105
-
106
-
107
-
108
-
109
-
110
-
111
-
112
-
113
-
114
-
115
-
116
-
117
-
118
-
119
-
120
-
121
-
122
-
123
-
124
-
125
-
126
-
127
-
128
-
129
-
130
-
131
-
132
-
133
-
134
-
135
-
136
-
137
-
138
-
139
-
140
-
141
-
142
-
143
-
144
-
145
-
146
-
147
-
148
-
149
-
150
-
151
-
152
-
153
-
154
-
155
-
156
-
157
-
158
-
159
-
160
-
161
-
162
-
163
-
164
-
165
-
166
-
167
-
168
-
169
-
170
-
171
-
172
-
173
-
174
-
175
-
176
-
177
-
178
-
179
-
180
-
181
-
182
-
183
-
184
-
185
-
186
-
187
-
188
-
189
-
190
-
191
-
192
-
193
-
194
-
195
-
196
-
197
-
198
-
199
-
200
-
201
-
202
-
203
-
204
-
205
-
206
-
207
-
208
-
209
-
210
-
211
-
212
-
213
-
214
-
215
-
216
-
217
-
218
-
219
-
220
 |
 |

58
• Yield on average interest-earning investments increased from 7.24% in fiscal 2012 to 7.73% in fiscal
2013. The yield on Statutory Liquidity Ratio (SLR) securities increased from 7.34% in fiscal 2012 to
7.80% in fiscal 2013 primarily due to investments in longer duration SLR securities at higher yields
and maturities of low yielding securities. The yield on average interest-earning non-SLR investments
increased from 7.10% in fiscal 2012 to 7.62% in fiscal 2013.
• Interest income also includes interest on income tax refund of ` 2.58 billion in fiscal 2013 compared
to ` 0.80 billion in fiscal 2012. The receipt, amount and timing of such income depends on the nature
and timing of determinations by tax authorities and is not consistent or predictable.
• During fiscal 2013, the impact on interest income of losses on securitised pools of assets (including
credit losses on existing pools) was ` 0.28 billion compared to ` 2.02 billion in fiscal 2012.
• RBI reduced the CRR by 200 basis points in phases during fiscal 2012 and fiscal 2013. CRR was 6.00%
at September 30, 2011, 4.75% at March 31, 2012 and 4.00% at March 31, 2013. As CRR balances
do not earn any interest income, the reduction had a positive impact on the yield on interest-earning
assets during fiscal 2013.
The cost of funds increased from 6.33% in fiscal 2012 to 6.43% in fiscal 2013 primarily due to the
following factors:
• The cost of deposits increased from 6.12% in fiscal 2012 to 6.38% in fiscal 2013. The cost of average
term deposits increased by 26 basis points from 8.21% in fiscal 2012 to 8.47% in fiscal 2013, reflecting
the full impact of the systemic increase in deposit rates in fiscal 2012. This was partly offset by
decrease in the cost of borrowings from 6.71% in fiscal 2012 to 6.54% in fiscal 2013.
Net interest margin of overseas branches improved from 1.23% for fiscal 2012 to 1.34% for fiscal 2013
primarily due to increase in yield on advances. Yield on overseas advances increased primarily due to
new disbursements at higher interest rates. Further, during fiscal 2012, there were repayments and
prepayments of low yielding loans. The full impact of the reduction in low yielding loans was reflected
during fiscal 2013. The increase in yield on advances was offset, in part, by the impact of higher liquidity
maintained in the international operations during the year.
The reduction of CRR by 75 basis points to 4.00% and reduction in repo rate by 100 basis points to 7.50%
by RBI during fiscal 2013, indicates a reversal in policy stance. While the interest rates in the system
are believed to have peaked, the extent and timing of decline in interest rates will depend on systemic
liquidity, the future movement of inflation as well as on the evolving fiscal situation.
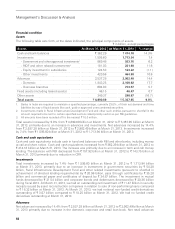
The following table sets forth, for the period indicated, the trend in average interest-earning assets and
average interest-bearing liabilities:
` in billion, except percentages
Fiscal 2012 Fiscal 2013 % change
Advances ` 2,316.69 ` 2,751.19 18.8%
Interest-earning investments 1,337.46 1,424.90 6.5
Other interest-earning assets 278.44 289.31 3.9
Total interest-earning assets 3,932.59 4,465.40 13.5
Deposits 2,335.93 2,648.48 13.4
Borrowings31,267.58 1,424.99 12.4
Total interest-bearing liabilities ` 3,603.51 ` 4,073.47 13.0%
1. Average investments and average borrowings include average short-term re-purchase transactions.
2. Average balances are the averages of daily balances, except averages of foreign branches which are calculated
on a fortnightly basis.
3. Borrowings exclude preference share capital.
The average volume of interest-earning assets increased by 13.5% from ` 3,932.59 billion in fiscal 2012 to
` 4,465.40 billion in fiscal 2013. The increase in average interest-earning assets was primarily on account
of an increase in average advances by ` 434.50 billion and average interest-earning investments by
` 87.44 billion.
Management’s Discussion & Analysis