ICICI Bank 2013 Annual Report Download - page 87
Download and view the complete annual report
Please find page 87 of the 2013 ICICI Bank annual report below. You can navigate through the pages in the report by either clicking on the pages listed below, or by using the keyword search tool below to find specific information within the annual report.-
 1
1 -
2
-
3
-
4
-
5
-
6
-
7
-
8
-
9
-
10
-
11
-
12
-
13
-
14
-
15
-
16
-
17
-
18
-
19
-
20
-
21
-
22
-
23
-
24
-
25
-
26
-
27
-
28
-
29
-
30
-
31
-
32
-
33
-
34
-
35
-
36
-
37
-
38
-
39
-
40
-
41
-
42
-
43
-
44
-
45
-
46
-
47
-
48
-
49
-
50
-
51
-
52
-
53
-
54
-
55
-
56
-
57
-
58
-
59
-
60
-
61
-
62
-
63
-
64
-
65
-
66
-
67
-
68
-
69
-
70
-
71
-
72
-
73
-
74
-
75
-
76
-
 77
77 -
 78
78 -
 79
79 -
 80
80 -
 81
81 -
 82
82 -
 83
83 -
 84
84 -
 85
85 -
 86
86 -
 87
87 -
 88
88 -
 89
89 -
 90
90 -
 91
91 -
 92
92 -
 93
93 -
 94
94 -
 95
95 -
 96
96 -
 97
97 -
98
-
99
-
100
-
101
-
102
-
103
-
104
-
105
-
106
-
107
-
108
-
109
-
110
-
111
-
112
-
113
-
114
-
115
-
116
-
117
-
118
-
119
-
120
-
121
-
122
-
123
-
124
-
125
-
126
-
127
-
128
-
129
-
130
-
131
-
132
-
133
-
134
-
135
-
136
-
137
-
138
-
139
-
140
-
141
-
142
-
143
-
144
-
145
-
146
-
147
-
148
-
149
-
150
-
151
-
152
-
153
-
154
-
155
-
156
-
157
-
158
-
159
-
160
-
161
-
162
-
163
-
164
-
165
-
166
-
167
-
168
-
169
-
170
-
171
-
172
-
173
-
174
-
175
-
176
-
177
-
178
-
179
-
180
-
181
-
182
-
183
-
184
-
185
-
186
-
187
-
188
-
189
-
190
-
191
-
192
-
193
-
194
-
195
-
196
-
197
-
198
-
199
-
200
-
201
-
202
-
203
-
204
-
205
-
206
-
207
-
208
-
209
-
210
-
211
-
212
-
213
-
214
-
215
-
216
-
217
-
218
-
219
-
220
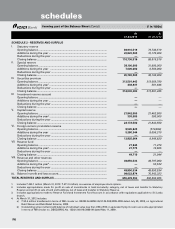
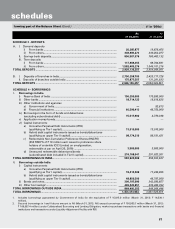
 |
 |

F9
At
31.03.2013
At
31.03.2012
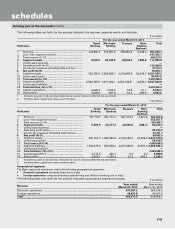
SCHEDULE 8 - INVESTMENTS
I. Investments in India [net of provisions]
i) Government securities ........................................................................................ 923,762,915 869,480,205
ii) Other approved securities ................................................................................... —4,250
iii) Shares (includes equity and preference shares) ................................................ 25,050,852 22,922,636
iv) Debentures and bonds ........................................................................................ 174,775,171 195,135,236
v) Subsidiaries and/or joint ventures ...................................................................... 65,482,766 64,796,927
vi) Others (commercial paper, mutual fund units, pass through certificates,
security receipts, certificate of deposits, Rural Infrastructure Development
Fund deposits and other related investments) ................................................... 447,127,306 361,872,334
TOTAL INVESTMENTS IN INDIA ...................................................................................... 1,636,199,010 1,514,211,588
II. Investments outside India [net of provisions]
i) Government securities ........................................................................................ 6,574,742 4,399,569
ii) Subsidiaries and/or joint ventures abroad
(includes equity and preference shares) ............................................................ 62,475,493 66,864,257
iii) Others (equity shares, bonds and certificate of deposits) ................................. 8,686,748 10,125,016
TOTAL INVESTMENTS OUTSIDE INDIA .......................................................................... 77,736,983 81,388,842
TOTAL INVESTMENTS ...................................................................................................... 1,713,935,993 1,595,600,430
A. Investments in India
Gross value of investments ....................................................................................... 1,663,577,178 1,539,777,243
Less: Aggregate of provision/depreciation/(appreciation) ....................................... 27,378,168 25,565,655
Net investments.......................................................................................................... 1,636,199,010 1,514,211,588
B. Investments outside India
Gross value of investments ....................................................................................... 77,981,759 81,826,347
Less: Aggregate of provision/depreciation/(appreciation) ....................................... 244,776 437,505
Net investments.......................................................................................................... 77,736,983 81,388,842
TOTAL INVESTMENTS ...................................................................................................... 1,713,935,993 1,595,600,430
SCHEDULE 9 - ADVANCES [net of provisions]
A. i) Bills purchased and discounted .......................................................................... 61,532,333 48,693,815
ii) Cash credits, overdrafts and loans repayable on demand ................................ 451,092,674 334,851,948
iii) Term loans ............................................................................................................ 2,389,869,344 2,153,730,816
TOTAL ADVANCES ............................................................................................................ 2,902,494,351 2,537,276,579
B. i) Secured by tangible assets (includes advances against book debts) ............... 2,471,296,382 2,138,141,465
ii) Covered by bank/government guarantees ......................................................... 22,221,201 13,869,020
iii) Unsecured ............................................................................................................ 408,976,768 385,266,094
TOTAL ADVANCES ............................................................................................................ 2,902,494,351 2,537,276,579
C. I. Advances in India
i) Priority sector ................................................................................................ 597,940,480 592,856,433
ii) Public sector .................................................................................................. 13,438,496 11,968,345
iii) Banks ............................................................................................................. 187,857 154,618
iv) Others ............................................................................................................ 1,557,357,190 1,238,268,015
TOTAL ADVANCES IN INDIA ............................................................................................ 2,168,924,023 1,843,247,411
II. Advances outside India
i) Due from banks ............................................................................................ 18,107,068 22,280,480
ii) Due from others
a) Bills purchased and discounted ............................................................. 17,437,061 5,098,400
b) Syndicated and term loans ..................................................................... 680,864,553 647,151,172
c) Others ...................................................................................................... 17,161,646 19,499,116
TOTAL ADVANCES OUTSIDE INDIA ................................................................................ 733,570,328 694,029,168
TOTAL ADVANCES ............................................................................................................ 2,902,494,351 2,537,276,579
(` in ‘000s)
forming part of the Balance Sheet (Contd.)
schedules