ICICI Bank 2013 Annual Report Download - page 76
Download and view the complete annual report
Please find page 76 of the 2013 ICICI Bank annual report below. You can navigate through the pages in the report by either clicking on the pages listed below, or by using the keyword search tool below to find specific information within the annual report.-
 1
1 -
2
-
3
-
4
-
5
-
6
-
7
-
8
-
9
-
10
-
11
-
12
-
13
-
14
-
15
-
16
-
17
-
18
-
19
-
20
-
21
-
22
-
23
-
24
-
25
-
26
-
27
-
28
-
29
-
30
-
31
-
32
-
33
-
34
-
35
-
36
-
37
-
38
-
39
-
40
-
41
-
42
-
43
-
44
-
45
-
46
-
47
-
48
-
49
-
50
-
51
-
52
-
53
-
54
-
55
-
56
-
57
-
58
-
59
-
60
-
61
-
62
-
63
-
64
-
65
-
 66
66 -
 67
67 -
 68
68 -
 69
69 -
 70
70 -
 71
71 -
 72
72 -
 73
73 -
 74
74 -
 75
75 -
 76
76 -
 77
77 -
 78
78 -
 79
79 -
 80
80 -
 81
81 -
 82
82 -
 83
83 -
 84
84 -
 85
85 -
 86
86 -
87
-
88
-
89
-
90
-
91
-
92
-
93
-
94
-
95
-
96
-
97
-
98
-
99
-
100
-
101
-
102
-
103
-
104
-
105
-
106
-
107
-
108
-
109
-
110
-
111
-
112
-
113
-
114
-
115
-
116
-
117
-
118
-
119
-
120
-
121
-
122
-
123
-
124
-
125
-
126
-
127
-
128
-
129
-
130
-
131
-
132
-
133
-
134
-
135
-
136
-
137
-
138
-
139
-
140
-
141
-
142
-
143
-
144
-
145
-
146
-
147
-
148
-
149
-
150
-
151
-
152
-
153
-
154
-
155
-
156
-
157
-
158
-
159
-
160
-
161
-
162
-
163
-
164
-
165
-
166
-
167
-
168
-
169
-
170
-
171
-
172
-
173
-
174
-
175
-
176
-
177
-
178
-
179
-
180
-
181
-
182
-
183
-
184
-
185
-
186
-
187
-
188
-
189
-
190
-
191
-
192
-
193
-
194
-
195
-
196
-
197
-
198
-
199
-
200
-
201
-
202
-
203
-
204
-
205
-
206
-
207
-
208
-
209
-
210
-
211
-
212
-
213
-
214
-
215
-
216
-
217
-
218
-
219
-
220
 |
 |

74
Profit after tax of ICICI Bank UK PLC decreased from ` 1.22 billion (USD 25.4 million) in fiscal 2012 to
` 0.78 billion (USD 14.4 million) in fiscal 2013 primarily due to decrease in net interest income and higher
provisions offset, in part, by higher mark-to-market gains on derivatives in fiscal 2013 and decrease in
realised loss on sale of investments. The decrease in net interest income was on account of decline in
average volume of interest-earning assets.
Profit after tax of ICICI Bank Eurasia Limited Liability Company increased from ` 0.21 billion in fiscal 2012 to
` 0.33 billion in fiscal 2013.
Profit after tax of ICICI Securities Primary Dealership Limited increased from ` 0.86 billion in fiscal 2012 to
` 1.22 billion in fiscal 2013 due to increase in trading gains. Trading gains increased in fiscal 2013 on
account of higher trading opportunities as yield on 10-year government securities declined in fiscal 2013
compared to an increase during fiscal 2012.
Profit after tax of ICICI Securities Limited decreased from ` 0.77 billion in fiscal 2012 to ` 0.64 billion in
fiscal 2013 primarily due to increase in staff cost and administrative expenses offset, in part, by increase
in net interest income.
Profit after tax of ICICI Home Finance Company Limited decreased from ` 2.60 billion in fiscal 2012
to ` 2.20 billion in fiscal 2013 primarily due to decrease in net interest income offset, in part, by lower
provision on loans.
Profit after tax of ICICI Prudential Asset Management Company increased from ` 0.88 billion in fiscal 2012
to ` 1.10 billion in fiscal 2013 primarily due to increase in fee income on account of increase in average
assets under management.
Profit after tax of ICICI Venture Funds Management Company Limited decreased from ` 0.68 billion in
fiscal 2012 to ` 0.20 billion in fiscal 2013 primarily due to decrease in management fees and decrease in
distribution of income from venture capital funds.
Consolidated assets of the Bank and its subsidiaries and other consolidating entities increased from
` 6,192.87 billion at March 31, 2012 to ` 6,748.22 billion at March 31, 2013 primarily due to increase
in assets of ICICI Bank, ICICI Life, ICICI Bank Canada and ICICI Securities Primary Dealership Limited.
Consolidated advances of the Bank and its subsidiaries increased from ` 2,921.25 billion at March 31,
2012 to ` 3,299.74 billion at March 31, 2013.
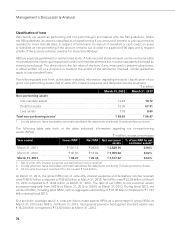
The following table sets forth, for the periods indicated, the profit/(loss) of our principal subsidiaries.
` in billion
Company Fiscal 2012 Fiscal 2013
ICICI Prudential Life Insurance Company Limited ` 13.84 ` 14.96
ICICI Lombard General Insurance Company Limited (4.16) 3.06
ICICI Bank Canada 1.66 2.37
ICICI Bank UK PLC 1.22 0.78
ICICI Bank Eurasia Limited Liability Company 0.21 0.33
ICICI Securities Primary Dealership Limited 0.86 1.22
ICICI Securities Limited 0.77 0.64
ICICI Home Finance Company Limited 2.60 2.20
ICICI Prudential Asset Management Company Limited 0.88 1.10
ICICI Venture Funds Management Company Limited ` 0.68 ` 0.20
Management’s Discussion & Analysis