ICICI Bank 2013 Annual Report Download - page 59
Download and view the complete annual report
Please find page 59 of the 2013 ICICI Bank annual report below. You can navigate through the pages in the report by either clicking on the pages listed below, or by using the keyword search tool below to find specific information within the annual report.-
 1
1 -
2
-
3
-
4
-
5
-
6
-
7
-
8
-
9
-
10
-
11
-
12
-
13
-
14
-
15
-
16
-
17
-
18
-
19
-
20
-
21
-
22
-
23
-
24
-
25
-
26
-
27
-
28
-
29
-
30
-
31
-
32
-
33
-
34
-
35
-
36
-
37
-
38
-
39
-
40
-
41
-
42
-
43
-
44
-
45
-
46
-
47
-
48
-
 49
49 -
 50
50 -
 51
51 -
 52
52 -
 53
53 -
 54
54 -
 55
55 -
 56
56 -
 57
57 -
 58
58 -
 59
59 -
 60
60 -
 61
61 -
 62
62 -
 63
63 -
 64
64 -
 65
65 -
 66
66 -
 67
67 -
 68
68 -
 69
69 -
70
-
71
-
72
-
73
-
74
-
75
-
76
-
77
-
78
-
79
-
80
-
81
-
82
-
83
-
84
-
85
-
86
-
87
-
88
-
89
-
90
-
91
-
92
-
93
-
94
-
95
-
96
-
97
-
98
-
99
-
100
-
101
-
102
-
103
-
104
-
105
-
106
-
107
-
108
-
109
-
110
-
111
-
112
-
113
-
114
-
115
-
116
-
117
-
118
-
119
-
120
-
121
-
122
-
123
-
124
-
125
-
126
-
127
-
128
-
129
-
130
-
131
-
132
-
133
-
134
-
135
-
136
-
137
-
138
-
139
-
140
-
141
-
142
-
143
-
144
-
145
-
146
-
147
-
148
-
149
-
150
-
151
-
152
-
153
-
154
-
155
-
156
-
157
-
158
-
159
-
160
-
161
-
162
-
163
-
164
-
165
-
166
-
167
-
168
-
169
-
170
-
171
-
172
-
173
-
174
-
175
-
176
-
177
-
178
-
179
-
180
-
181
-
182
-
183
-
184
-
185
-
186
-
187
-
188
-
189
-
190
-
191
-
192
-
193
-
194
-
195
-
196
-
197
-
198
-
199
-
200
-
201
-
202
-
203
-
204
-
205
-
206
-
207
-
208
-
209
-
210
-
211
-
212
-
213
-
214
-
215
-
216
-
217
-
218
-
219
-
220
 |
 |

Annual Report 2012-2013 57
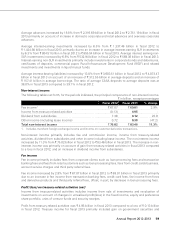
Net interest income and spread analysis
The following table sets forth, for the periods indicated, the net interest income and spread analysis.
` in billion, except percentages
Fiscal 2012 Fiscal 2013 % change
Interest income ` 335.42 ` 400.75 19.5%
Interest expense 228.08 262.09 14.9
Net interest income 107.34 138.66 29.2
Average interest-earning assets13,932.59 4,465.40 13.5
Average interest-bearing liabilities1` 3,603.51 ` 4,073.47 13.0%
Net interest margin 2.73% 3.11% —
Average yield 8.53% 8.97% —
Average cost of funds 6.33% 6.43% —
Interest spread 2.20% 2.54% —
1. The average balances are the averages of daily balances, except averages of foreign branches which are
calculated on a fortnightly basis.
2. All amounts have been rounded off to the nearest ` 10.0 million.
Net interest income increased by 29.2% from ` 107.34 billion in fiscal 2012 to ` 138.66 billion in fiscal
2013 reflecting an increase in net interest margin from 2.73% in fiscal 2012 to 3.11% in fiscal 2013 and a
13.5% increase in the average volume of interest-earning assets.
The yield on interest-earning assets increased from 8.53% in fiscal 2012 to 8.97% in fiscal 2013 offset,
in part, by an increase in the cost of funds from 6.33% in fiscal 2012 to 6.43% in fiscal 2013. The interest
spread increased from 2.20% in fiscal 2012 to 2.54% in fiscal 2013. Net interest margin increased from
2.73% in fiscal 2012 to 3.11% in fiscal 2013.
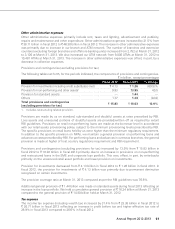
The following table sets forth, for the periods indicated, the trend in yield, cost, spread and margin.
Fiscal 2012 Fiscal 2013
Yield on interest-earning assets 8.53% 8.97%
- On advances 9.55 9.94
- On investments 7.24 7.73
- On SLR investments 7.34 7.80
- On other investments 7.10 7.62
- On other interest-earning assets 6.21 5.96
Cost of interest-bearing liabilities 6.33 6.43
- Cost of deposits 6.12 6.38
- Current and savings account (CASA) deposits 2.87 2.97
- Term deposits 8.21 8.47
- Cost of borrowings 6.71 6.54
Interest spread 2.20 2.54
Net interest margin 2.73% 3.11%
Yield on interest-earning assets increased from 8.53% in fiscal 2012 to 8.97% in fiscal 2013 primarily due
to the following factors:
• Yield on average advances increased from 9.55% in fiscal 2012 to 9.94% in fiscal 2013 primarily
due to an increase in yield on domestic and overseas corporate loans as a result of incremental
disbursements at higher lending rates and the full impact of increase in our base rate during fiscal
2012. However, subsequently we reduced our base rate to 9.75% with effect from April 23, 2012 in
response to a decrease in repo rate by 50 basis points in April 2012.