ICICI Bank 2013 Annual Report Download - page 72
Download and view the complete annual report
Please find page 72 of the 2013 ICICI Bank annual report below. You can navigate through the pages in the report by either clicking on the pages listed below, or by using the keyword search tool below to find specific information within the annual report.-
 1
1 -
2
-
3
-
4
-
5
-
6
-
7
-
8
-
9
-
10
-
11
-
12
-
13
-
14
-
15
-
16
-
17
-
18
-
19
-
20
-
21
-
22
-
23
-
24
-
25
-
26
-
27
-
28
-
29
-
30
-
31
-
32
-
33
-
34
-
35
-
36
-
37
-
38
-
39
-
40
-
41
-
42
-
43
-
44
-
45
-
46
-
47
-
48
-
49
-
50
-
51
-
52
-
53
-
54
-
55
-
56
-
57
-
58
-
59
-
60
-
61
-
 62
62 -
 63
63 -
 64
64 -
 65
65 -
 66
66 -
 67
67 -
 68
68 -
 69
69 -
 70
70 -
 71
71 -
 72
72 -
 73
73 -
 74
74 -
 75
75 -
 76
76 -
 77
77 -
 78
78 -
 79
79 -
 80
80 -
 81
81 -
 82
82 -
83
-
84
-
85
-
86
-
87
-
88
-
89
-
90
-
91
-
92
-
93
-
94
-
95
-
96
-
97
-
98
-
99
-
100
-
101
-
102
-
103
-
104
-
105
-
106
-
107
-
108
-
109
-
110
-
111
-
112
-
113
-
114
-
115
-
116
-
117
-
118
-
119
-
120
-
121
-
122
-
123
-
124
-
125
-
126
-
127
-
128
-
129
-
130
-
131
-
132
-
133
-
134
-
135
-
136
-
137
-
138
-
139
-
140
-
141
-
142
-
143
-
144
-
145
-
146
-
147
-
148
-
149
-
150
-
151
-
152
-
153
-
154
-
155
-
156
-
157
-
158
-
159
-
160
-
161
-
162
-
163
-
164
-
165
-
166
-
167
-
168
-
169
-
170
-
171
-
172
-
173
-
174
-
175
-
176
-
177
-
178
-
179
-
180
-
181
-
182
-
183
-
184
-
185
-
186
-
187
-
188
-
189
-
190
-
191
-
192
-
193
-
194
-
195
-
196
-
197
-
198
-
199
-
200
-
201
-
202
-
203
-
204
-
205
-
206
-
207
-
208
-
209
-
210
-
211
-
212
-
213
-
214
-
215
-
216
-
217
-
218
-
219
-
220
 |
 |

70
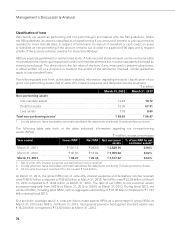
Classification of loans
We classify our assets as performing and non-performing in accordance with the RBI guidelines. Under
the RBI guidelines, an asset is classified as non-performing if any amount of interest or principal remains
overdue for more than 90 days, in respect of term loans. In respect of overdraft or cash credit, an asset
is classified as non-performing if the account remains out of order for a period of 90 days and in respect
of bills, if the account remains overdue for more than 90 days.
RBI has separate guidelines for restructured loans. A fully secured standard asset can be restructured by
re-schedulement of principal repayments and/or the interest element, but must be separately disclosed as
a restructured asset. The diminution in the fair value of the loan, if any, measured in present value terms,
is either written off or a provision is made to the extent of the diminution involved. Similar guidelines
apply to sub-standard loans.
The following table sets forth, at the dates indicated, information regarding the asset classification of our
gross non-performing assets (net of write-offs, interest suspense and derivative income reversals).
` in billion
March 31, 2012 March 31, 2013
Non-performing assets
Sub-standard assets 14.49 18.72
Doubtful assets 73.35 67.91
Loss assets 7.79 9.84
Total non-performing assets1` 95.63 ` 96.47
1. Include advances, lease receivables and credit substitutes like debentures and bonds. Exclude preference shares.
The following table sets forth, at the dates indicated, information regarding our non-performing
assets (NPAs).
` in billion, except percentages
Year ended Gross NPA1Net NPA Net customer
assets
% of net NPA to net
customer assets2
March 31, 2011 ` 101.14 ` 24.58 ` 2,628.16 0.94%
March 31, 2012 ` 95.63 ` 18.94 ` 3,059.84 0.62%
March 31, 2013 ` 96.47 ` 22.34 ` 3,517.62 0.64%
1. Net of write-offs, interest suspense and derivatives income reversal.
2. Include advances, lease receivables and credit substitutes like debentures and bonds. Exclude preference shares.
3. All amounts have been rounded off to the nearest ` 10.0 million.
At March 31, 2013, the gross NPAs (net of write-offs, interest suspense and derivatives income reversal)
were ` 96.47 billion compared to ` 95.63 billion at March 31, 2012. Net NPAs were ` 22.34 billion at March
31, 2013 compared to ` 18.94 billion at March 31, 2012. The ratio of net NPAs to net customer assets
increased marginally from 0.62% at March 31, 2012 to 0.64% at March 31, 2013. During fiscal 2013, we
wrote-off NPAs, including retail NPAs, with an aggregate outstanding of ` 16.46 billion compared to ` 11.83
billion during fiscal 2012.
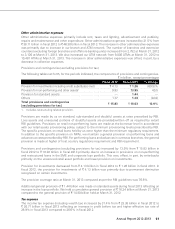
Our provision coverage ratio (i.e. total provisions made against NPAs as a percentage of gross NPAs) at
March 31, 2013 was 76.8%. At March 31, 2013, total general provision held against standard assets was
` 16.24 billion compared to ` 14.80 billion at March 31, 2012.
Management’s Discussion & Analysis