Volvo 2015 Annual Report Download - page 89
Download and view the complete annual report
Please find page 89 of the 2015 Volvo annual report below. You can navigate through the pages in the report by either clicking on the pages listed below, or by using the keyword search tool below to find specific information within the annual report.-
 1
1 -
2
-
3
-
4
-
5
-
6
-
7
-
8
-
9
-
10
-
11
-
12
-
13
-
14
-
15
-
16
-
17
-
18
-
19
-
20
-
21
-
22
-
23
-
24
-
25
-
26
-
27
-
28
-
29
-
30
-
31
-
32
-
33
-
34
-
35
-
36
-
37
-
38
-
39
-
40
-
41
-
42
-
43
-
44
-
45
-
46
-
47
-
48
-
49
-
50
-
51
-
52
-
53
-
54
-
55
-
56
-
57
-
58
-
59
-
60
-
61
-
62
-
63
-
64
-
65
-
66
-
67
-
68
-
69
-
70
-
71
-
72
-
73
-
74
-
75
-
76
-
77
-
78
-
 79
79 -
 80
80 -
 81
81 -
 82
82 -
 83
83 -
 84
84 -
 85
85 -
 86
86 -
 87
87 -
 88
88 -
 89
89 -
 90
90 -
 91
91 -
 92
92 -
 93
93 -
 94
94 -
 95
95 -
 96
96 -
 97
97 -
 98
98 -
 99
99 -
100
-
101
-
102
-
103
-
104
-
105
-
106
-
107
-
108
-
109
-
110
-
111
-
112
-
113
-
114
-
115
-
116
-
117
-
118
-
119
-
120
-
121
-
122
-
123
-
124
-
125
-
126
-
127
-
128
-
129
-
130
-
131
-
132
-
133
-
134
-
135
-
136
-
137
-
138
-
139
-
140
-
141
-
142
-
143
-
144
-
145
-
146
-
147
-
148
-
149
-
150
-
151
-
152
-
153
-
154
-
155
-
156
-
157
-
158
-
159
-
160
-
161
-
162
-
163
-
164
-
165
-
166
-
167
-
168
-
169
-
170
-
171
-
172
-
173
-
174
-
175
-
176
-
177
-
178
-
179
-
180
-
181
-
182
-
183
-
184
-
185
-
186
-
187
-
188
-
189
-
190
-
191
-
192
-
193
-
194
-
195
-
196
-
197
-
198
-
199
-
200
-
201
-
202
-
203
-
204
 |
 |
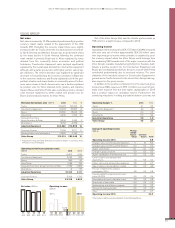
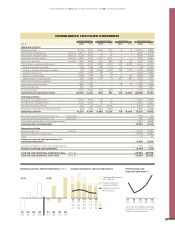
CONSOLIDATED CASH FLOW STATEMENTS
Industrial operations Customer Finance Eliminations Volvo Group Total
SEK M 2015 2014 2015 2014 2015 2014 2015 2014
Operating activities
Operating income 21,313 4,103 2,006 1,712 2 8 23,321 5,823
Depreciation tangible assets Note 13 6,431 6,701 13 15 – – 6,443 6,716
Amortization intangible assets Note 12 3,314 3,503 31 31 – – 3,344 3,534
Depreciation leasing vehicles Note 13 2,830 2,470 4,190 3,211 0 –1 7,020 5,680
Other non-cash items Note 29 –1,083 5,288 796 888 –165 –35 –452 6,141
Total change in working capital whereof –1,979 –3,272 –7,485 –4,772 315 –6,059 –9,149 –14,103
Change in accounts receivable 642 1,346 –126 –133 –2 – 514 1,213
Change in customer-financing receivables 140 –144 –8,346 –4,740 –108 –5,756 –8,313 –10,640
Change in inventories –2,234 –1,594 –90 –28 0––2,324–1,622
Change in trade payables –1,210 –995 114 65 –2 131 –1,098 –799
Other changes in working capital 683 –1,884 963 64 427 –435 2,073 –2,255
Interest and similar items received 374317––1–375317
Interest and similar items paid –1,665 –1,879 – – –18 33 –1,683 –1,846
Other financial items –252–221–––––252–221
Income taxes paid –2,573 –2,680 –531 –624 –5 – –3,110 –3,304
Cash flow from operating activities 26,709 14,331 –981 461 129 –6,055 25,858 8,737
Investing activities
Investments in tangible assets –6,539 –7,079 –22 –14 – – –6,561 –7,093
Investments in intangible assets –2,241 –1,523 –16 –18 – – –2,257 –1,541
Investment in leasing vehicles –328 –470 –10,201 –9,645 – – –10,529 –10,115
Disposals of fixed assets and leasing vehicles 668 1,090 5,356 3,949 –4 –1 6,020 5,038
Operating cash flow 18,270 6,349 –5,865 –5,267 126 –6,056 12,531 –4,973
Investments and divestments of shares, net Note 5, 29 –1, 984 69
Acquired and divested operations, net Note 3, 29 408 7,398
Interest-bearing receivables incl marketable securities 3,552 –4,808
Cash flow after net investments 14,507 –2,314
Financing activities
Change in loans, net Note 29 –13,247 6,686
Dividend to AB Volvo’s shareholders –6,090 –6,084
Other 14 –57
Change in cash and cash equivalents excl.
translation differences –4,815 –1,769
Translation difference on cash and cash equivalents –378 1,044
Change in cash and cash equivalents –5,194 –725
Cash and cash equivalents, beginning of year Note 18 26,242 26,968
Cash and cash equivalents, end of year Note 18 21,048 26,242
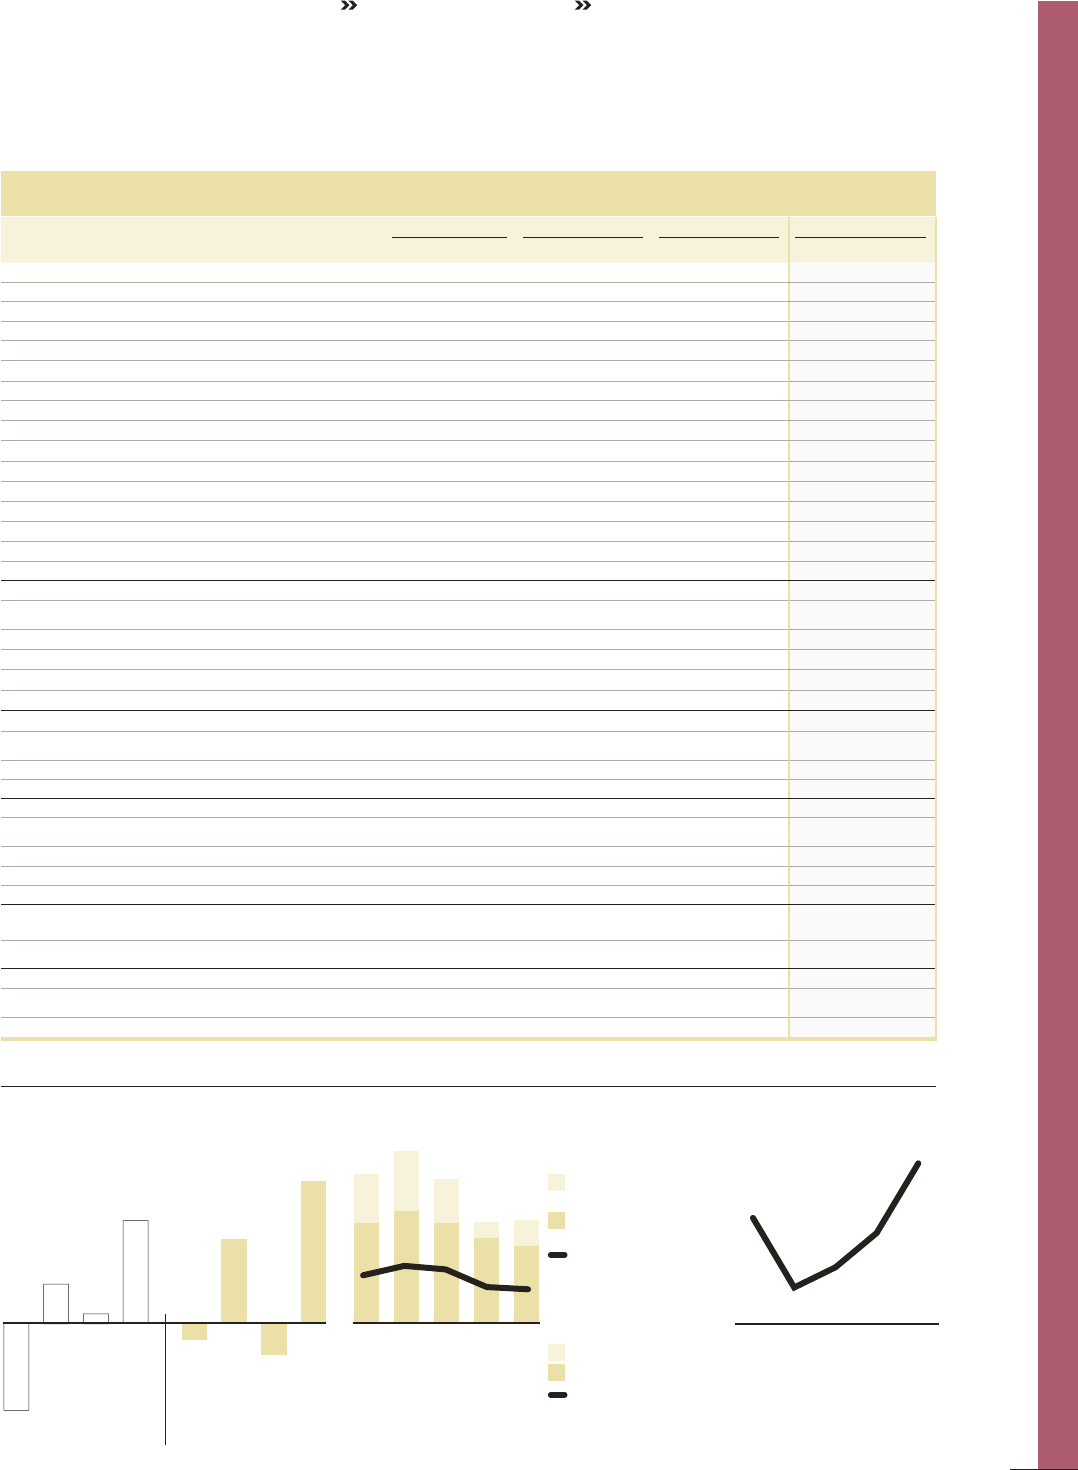
Capital expenditures, Industrial Operations
13
12
11 14
4.1
8.5
4.9
9.5
4.6 3.1
8.5
4.1 5.1 3.7
7.2
1.4
15
2.9
6.5
2.2
Capital expenditures,
% of net sales
Property, plant and
equipment, SEK bn
Capitalized development
costs, SEK bn
Self-financing ratio,
Industrial Operations %
131211
72
14
112 180210
15
316
Cash-flow from operating activities
divided by net investments in fixed
assets and leasing assets.
Operating cash flow, Industrial Operations, SEK bn
20152014
Q4
14.7
Q3
–3.3
Q2
8.6
Q1
–1.7
Q4
10.6
Q3
0.9
Q2
4.0
Q1
–9.0
GROUP PERFORMANCE BOARD OF DIRECTORS’ REPORT 2015 CASH FLOW STATEMENT
87