Volvo 2015 Annual Report Download - page 197
Download and view the complete annual report
Please find page 197 of the 2015 Volvo annual report below. You can navigate through the pages in the report by either clicking on the pages listed below, or by using the keyword search tool below to find specific information within the annual report.-
 1
1 -
2
-
3
-
4
-
5
-
6
-
7
-
8
-
9
-
10
-
11
-
12
-
13
-
14
-
15
-
16
-
17
-
18
-
19
-
20
-
21
-
22
-
23
-
24
-
25
-
26
-
27
-
28
-
29
-
30
-
31
-
32
-
33
-
34
-
35
-
36
-
37
-
38
-
39
-
40
-
41
-
42
-
43
-
44
-
45
-
46
-
47
-
48
-
49
-
50
-
51
-
52
-
53
-
54
-
55
-
56
-
57
-
58
-
59
-
60
-
61
-
62
-
63
-
64
-
65
-
66
-
67
-
68
-
69
-
70
-
71
-
72
-
73
-
74
-
75
-
76
-
77
-
78
-
79
-
80
-
81
-
82
-
83
-
84
-
85
-
86
-
87
-
88
-
89
-
90
-
91
-
92
-
93
-
94
-
95
-
96
-
97
-
98
-
99
-
100
-
101
-
102
-
103
-
104
-
105
-
106
-
107
-
108
-
109
-
110
-
111
-
112
-
113
-
114
-
115
-
116
-
117
-
118
-
119
-
120
-
121
-
122
-
123
-
124
-
125
-
126
-
127
-
128
-
129
-
130
-
131
-
132
-
133
-
134
-
135
-
136
-
137
-
138
-
139
-
140
-
141
-
142
-
143
-
144
-
145
-
146
-
147
-
148
-
149
-
150
-
151
-
152
-
153
-
154
-
155
-
156
-
157
-
158
-
159
-
160
-
161
-
162
-
163
-
164
-
165
-
166
-
167
-
168
-
169
-
170
-
171
-
172
-
173
-
174
-
175
-
176
-
177
-
178
-
179
-
180
-
181
-
182
-
183
-
184
-
185
-
186
-
 187
187 -
 188
188 -
 189
189 -
 190
190 -
 191
191 -
 192
192 -
 193
193 -
 194
194 -
 195
195 -
 196
196 -
 197
197 -
 198
198 -
 199
199 -
 200
200 -
 201
201 -
 202
202 -
 203
203 -
 204
204
 |
 |
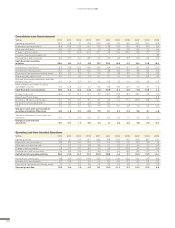
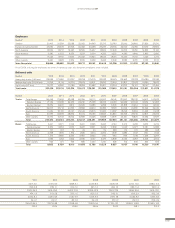
OTHER INFORMATION
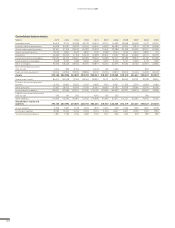
Key ratios
2015 2014 2013 2012 2011 2010 2009 2008 2007 2006 2005
Gross margin, %122.2 21.3 21.1 21.9 23.7 23.3 13.9 21.3 22.6 22.7 21.8
Research and development expenses
as percentage of net sales15.1 6.0 5.7 5.0 4.4 5.0 6.3 4.9 4.0 3.4 3.3
Selling expenses as percentage
of net sales18.5 9.3 10.1 9.0 8.0 8.8 11.4 8.7 8.9 8.0 8.5
Administration expenses as
percentage of net sales11.9 1.9 2.2 1.9 2.3 2.2 2.8 2.3 2.6 2.6 2.7
Return on shareholders’ equity, % 18.4 2.8 5.0 12.9 23.1 16.0 –19.7 12.1 18.1 19.6 17.8
Interest coverage, times19.1 2.2 2.1 6.7 9.6 5.9 –4.7 8.8 20.7 26.1 16.7
Self-financing ratio, % 194 64 84 18 118 270 137 5 153 189 116
Self-financing ratio Industrial
Operations, % 316 180 112 72 210 294 –16 78 265 235 173
Net Financial position incl. post-employ-
ment benefits SEK M –13,237 –26,378 –32,066 –22,978 –19,346 –24,691 –41,489 –29,795 –4,305 23,076 18,675
Net financial position incl. post-employ-
ment benefits as percentage
of shareholders’ equity1–17.6 –37.6 –46.8 –29.3 –25.2 –37.4 –70.9 –39.7 –5.7 29.2 23.7
Shareholders’ equity as percentage
of total assets 22.9 20.9 22.4 25.7 24.3 23.3 20.2 22.7 25.7 33.7 30.6
Shareholders’ equity as percentage
of total assets, Industrial Operations 28.6 25.7 27.0 30.9 28.5 26.9 23.8 28.4 30.8 40.6 40.4
Shareholders’ equity excluding minority
interest as percentage of total assets 22.4 20.5 22.0 25.2 23.9 23.0 20.0 22.6 25.6 33.6 30.5
1 Pertains to the Industrial Operations. For periods up to and including 2006, Volvo Financial Services is included and consolidated according to the equity method.
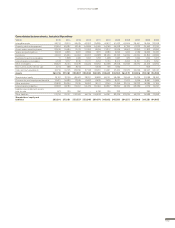
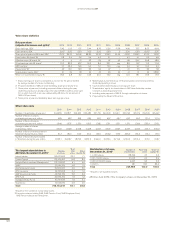
Exports from Sweden
SEK M 2015 2014 2013 2012 2011 2010 2009 2008 2007 2006 2005
Volvo Group, total 86,731 78,174 88,560 84,314 91,065 72,688 41,829 96,571 88,606 80,517 71,133
195