Volvo 2015 Annual Report Download - page 199
Download and view the complete annual report
Please find page 199 of the 2015 Volvo annual report below. You can navigate through the pages in the report by either clicking on the pages listed below, or by using the keyword search tool below to find specific information within the annual report.-
 1
1 -
2
-
3
-
4
-
5
-
6
-
7
-
8
-
9
-
10
-
11
-
12
-
13
-
14
-
15
-
16
-
17
-
18
-
19
-
20
-
21
-
22
-
23
-
24
-
25
-
26
-
27
-
28
-
29
-
30
-
31
-
32
-
33
-
34
-
35
-
36
-
37
-
38
-
39
-
40
-
41
-
42
-
43
-
44
-
45
-
46
-
47
-
48
-
49
-
50
-
51
-
52
-
53
-
54
-
55
-
56
-
57
-
58
-
59
-
60
-
61
-
62
-
63
-
64
-
65
-
66
-
67
-
68
-
69
-
70
-
71
-
72
-
73
-
74
-
75
-
76
-
77
-
78
-
79
-
80
-
81
-
82
-
83
-
84
-
85
-
86
-
87
-
88
-
89
-
90
-
91
-
92
-
93
-
94
-
95
-
96
-
97
-
98
-
99
-
100
-
101
-
102
-
103
-
104
-
105
-
106
-
107
-
108
-
109
-
110
-
111
-
112
-
113
-
114
-
115
-
116
-
117
-
118
-
119
-
120
-
121
-
122
-
123
-
124
-
125
-
126
-
127
-
128
-
129
-
130
-
131
-
132
-
133
-
134
-
135
-
136
-
137
-
138
-
139
-
140
-
141
-
142
-
143
-
144
-
145
-
146
-
147
-
148
-
149
-
150
-
151
-
152
-
153
-
154
-
155
-
156
-
157
-
158
-
159
-
160
-
161
-
162
-
163
-
164
-
165
-
166
-
167
-
168
-
169
-
170
-
171
-
172
-
173
-
174
-
175
-
176
-
177
-
178
-
179
-
180
-
181
-
182
-
183
-
184
-
185
-
186
-
187
-
188
-
 189
189 -
 190
190 -
 191
191 -
 192
192 -
 193
193 -
 194
194 -
 195
195 -
 196
196 -
 197
197 -
 198
198 -
 199
199 -
 200
200 -
 201
201 -
 202
202 -
 203
203 -
 204
204
 |
 |

OTHER INFORMATION
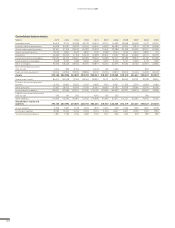
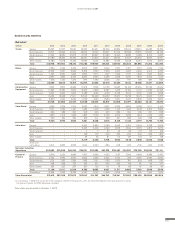
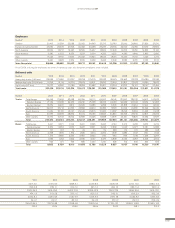
Business area statistics
Net sales1
SEK M 2015 2014 2013 2012 2011 2010 2009 2008 2007 2006 2005
Trucks Europe 83,767 72,757 73,640 76,365 83,451 69,606 65,874 109,914 108,651 93,282 79,706
North America 73,017 53,696 40,314 42,650 37,042 26,901 21,563 26,588 27,255 50,605 46,129
South America 11,624 19,669 23,318 21,172 26,847 21,680 12,490 14,680 11,483 9,213 7,657
Asia 31,589 29,264 26,740 36,531 37,840 35,231 26,943 37,515 26,593 8,975 13,551
Other markets 13,982 15,518 14,462 15,565 13,741 13,887 12,069 14,538 13,910 9,190 8,353
Total 213,978 190,904 178,474 192,283 198,920 167,305 138,940 203,235 187,892 171,265 155,396
Buses Europe 7,284 6,139 5,429 6,200 6,631 6,242 7,707 7,321 7,767 7, 924 7,142
North America 10,635 6,721 5,929 6,675 7,532 7,200 5,673 5,355 4,630 4,910 4,247
South America 1,425 2,559 1,836 2,794 2,715 1,737 1,235 1,571 1,623 1,537 2,641
Asia 2,557 1,892 2,055 2,853 2,953 3,299 2,749 2,094 1,802 2,003 1,612
Other markets 1,678 1,334 1,457 1,774 1,992 2,038 1,101 971 786 897 947
Total 23,580 18,645 16,707 20,295 21,823 20,516 18,465 17,312 16,608 17,271 16,589
Construction Europe 17,732 17,215 16,356 16,518 17,765 16,138 12,987 25,192 25,294 20,326 15,524
Equipment North America 11,843 10,784 8,319 12,027 7,829 6,267 5,475 10,159 11,170 11,280 10,337
South America 2,207 3,234 3,314 3,788 4,163 4,130 2,578 2,913 2,155 1,358 1,238
Asia 16,424 18,458 21,911 27,033 29, 999 24,352 12,957 13,738 12,179 6,903 5,717
Other markets 2,802 3,164 3,539 4,192 3,745 2,923 1,661 4,077 2,835 2,264 2,000
Total 51,008 52,855 53,437 63,558 63,500 53,810 35,658 56,079 53,633 42,131 34,816
Volvo Penta Europe 4,462 3,779 3,714 3,620 4,274 4,507 4,390 6,554 6,798 6,111 5,102
North America 2,161 1,584 1,491 1,486 1,379 1,500 1,100 1,947 2,674 2,815 2,832
South America 365 386 297 306 335 335 284 364 274 221 208
Asia 1,855 1,615 1,692 1,867 2,130 2,008 2,054 2,082 1,624 1,359 1,427
Other markets 562 425 356 352 341 366 331 486 349 268 207
Total 9,406 7,790 7,550 7,631 8,458 8,716 8,159 11,433 11,719 10,774 9,776
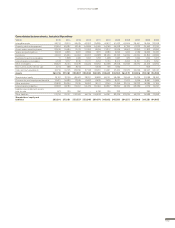
Volvo Aero Europe – – – 2,404 2,893 3,768 3,942 3,497 3,462 3,798 3,406
North America – – – 2,657 3,300 3,599 3,508 3,534 3,723 3,815 3,612
South America –––07273458127173168
Asia – – – 109 104 233 205 234 234 356 284
Other markets – – – 49 52 81 114 125 100 91 68
Total – – – 5,219 6,356 7,708 7,803 7,448 7,646 8,233 7,538
Other and
eliminations 5,610 5,806 9,252 7,044 4,532 –680 –538 –575 –703 –654 7,076
Net sales Industrial
Operations 303,582 275,999 265,420 296,031 303,589 257,375 208,487 294,932 276,795 249,020 231,191
Customer Europe 5,278 5,120 4,686 4,703 4,663 4,733 7,127 7,099 4,484 4,388 4,797
Finance North America 4,033 2,999 2,900 2,833 2,326 2,605 3,004 369 2,467 2,569 2,036
South America 1,116 1,122 1,009 1,195 1,131 1,156 1,070 791 620 608 570
Asia 548 638 707 795 571 435 435 158 87 45 101
Other markets 224 232 237 257 192 101 75 68 47 38 45
Tot al 11,199 10 ,111 9,539 9,783 8 , 88 3 9,031 11,711 8, 4 8 5 7,705 7, 6 48 7, 5 49
Eliminations –2,265 –3,162 –2,336 –2,167 –2,104 –1,658 –1,836 250 905 2,167 1,819
Volvo Group total 312,515 282,948 272,622 303,647 310,367 264,749 218,361 303,667 285,405 258,835 240,559
1 As of January 1, 2007, the results from the synergies created in the business units are transferred back to the various business areas.
Comparison figures for 2006 have been restated.
Volvo Aero was divested in October 1, 2012.
197