Volvo 2015 Annual Report Download - page 82
Download and view the complete annual report
Please find page 82 of the 2015 Volvo annual report below. You can navigate through the pages in the report by either clicking on the pages listed below, or by using the keyword search tool below to find specific information within the annual report.-
 1
1 -
2
-
3
-
4
-
5
-
6
-
7
-
8
-
9
-
10
-
11
-
12
-
13
-
14
-
15
-
16
-
17
-
18
-
19
-
20
-
21
-
22
-
23
-
24
-
25
-
26
-
27
-
28
-
29
-
30
-
31
-
32
-
33
-
34
-
35
-
36
-
37
-
38
-
39
-
40
-
41
-
42
-
43
-
44
-
45
-
46
-
47
-
48
-
49
-
50
-
51
-
52
-
53
-
54
-
55
-
56
-
57
-
58
-
59
-
60
-
61
-
62
-
63
-
64
-
65
-
66
-
67
-
68
-
69
-
70
-
71
-
 72
72 -
 73
73 -
 74
74 -
 75
75 -
 76
76 -
 77
77 -
 78
78 -
 79
79 -
 80
80 -
 81
81 -
 82
82 -
 83
83 -
 84
84 -
 85
85 -
 86
86 -
 87
87 -
 88
88 -
 89
89 -
 90
90 -
 91
91 -
 92
92 -
93
-
94
-
95
-
96
-
97
-
98
-
99
-
100
-
101
-
102
-
103
-
104
-
105
-
106
-
107
-
108
-
109
-
110
-
111
-
112
-
113
-
114
-
115
-
116
-
117
-
118
-
119
-
120
-
121
-
122
-
123
-
124
-
125
-
126
-
127
-
128
-
129
-
130
-
131
-
132
-
133
-
134
-
135
-
136
-
137
-
138
-
139
-
140
-
141
-
142
-
143
-
144
-
145
-
146
-
147
-
148
-
149
-
150
-
151
-
152
-
153
-
154
-
155
-
156
-
157
-
158
-
159
-
160
-
161
-
162
-
163
-
164
-
165
-
166
-
167
-
168
-
169
-
170
-
171
-
172
-
173
-
174
-
175
-
176
-
177
-
178
-
179
-
180
-
181
-
182
-
183
-
184
-
185
-
186
-
187
-
188
-
189
-
190
-
191
-
192
-
193
-
194
-
195
-
196
-
197
-
198
-
199
-
200
-
201
-
202
-
203
-
204
 |
 |
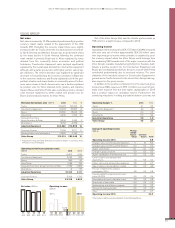
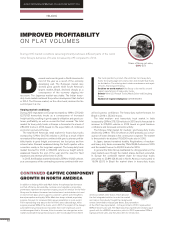
For the Volvo Group 2015 was a year with improved underlying profitability despite unchanged volumes.
IMPROVED UNDERLYING
PROFITABILITY
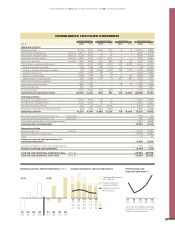
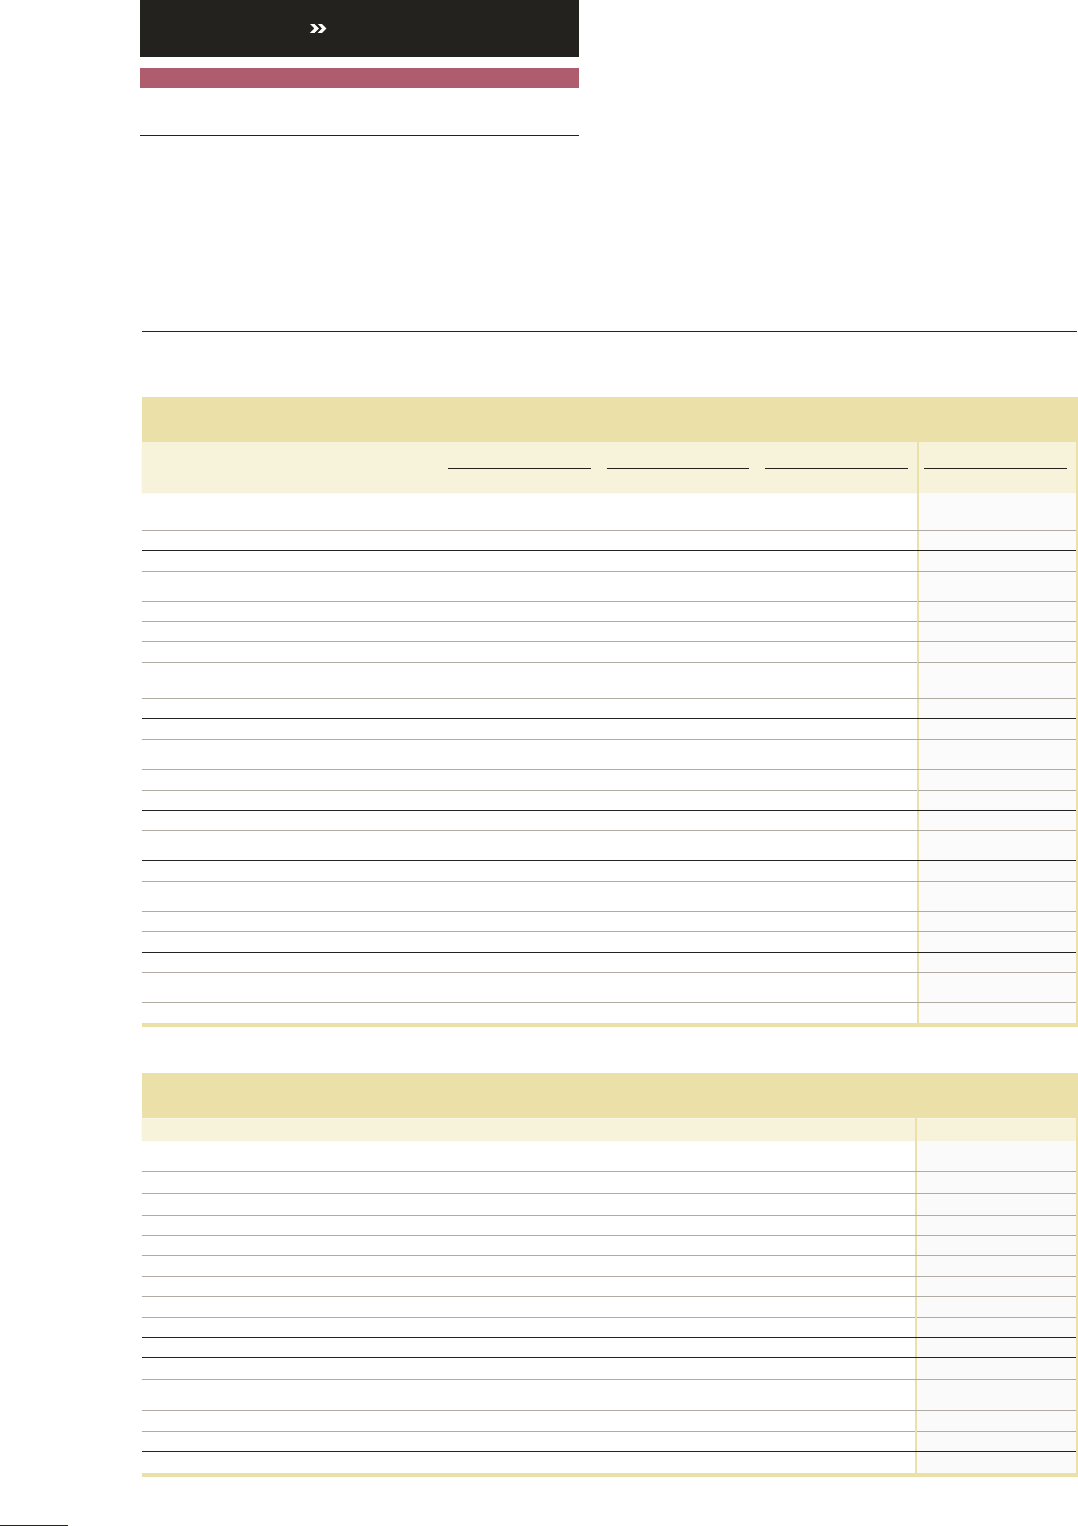
INCOME STATEMENTS VOLVO GROUP
Industrial Operations Customer Finance Eliminations Volvo Group
SEK M 2015 2014 2015 2014 2015 2014 2015 2014
Net sales
Note
6, 7 303,582 275,999 11,199 10,111 –2, 265 –3,162 312,515 282 ,948
Cost of sales –236,311 –217,251 –6,607 –5,923 2,265 3,162 –240,653 –220,012
Gross income 67,271 58,748 4,591 4,188 – – 71,862 62,937
Research and development expenses –15,368–16,656–––––15,368–16,656
Selling expenses –25,857 –25,778 –1,837 –1,670 – – –27,694 –27,448
Administrative expenses –5,728 –5,367 –41 –41 – – –5,769 –5,408
Other operating income and expenses Note 8 –3,473 –6,931 –706 –766 – – –4,179 –7,697
Income from investments in joint ventures
and associated companies
Note
5, 6–14346–––––14346
Income/lossfrom other investments Note 5 4,610 49 –2 1 – – 4,609 50
Operating income 21,312 4,111 2,006 1,712 – – 23,318 5,824
Interest income and similar credits 257328––––257328
Interest expenses and similar charges–2,366–1,9940––––2,366–1,994
Other financial income and expensesNote 9–7929310––––792931
Income after financial items 18,411 3,377 2,006 1,712 – – 20,418 5,089
Income taxes Note 10 –4,687 –2,287 –633 –568 – – –5,320 –2,854
Income for the period 13,725 1,091 1,373 1,145 – – 15,099 2,235
Attributable to:
Equity holders of the parent company 15,0582,099
Minority interests Note 11 41136
15,0992,235
Basic earnings per share, SEKNote 19 7.421.03
Diluted earnings per share, SEKNote 19 7.411.03
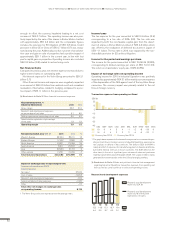
OTHER COMPREHENSIVE INCOME
SEK M 2015 2014
Income for the period 15,099 2,235
Items that will not be reclassified to income statement:
Remeasurements of defined benefit pension plans 2,783 –2,833
Items that may be reclassified subsequently to income statement:
Exchange differences on translation of foreign operations –2,481 5,998
Share of OCI related to joint ventures and associated companies 24 198
Accumulated translation difference reversed to income 45 33
Available-for-sale investments –3,837 3,067
Change in cash flow hedge reserve Note 19 –32 24
Other comprehensive income, net of income taxes –3,498 6,487
Total comprehensive income for the period 11,601 8,722
Attributable to:
Equity holders of the parent company 11, 52 7 8 , 3 3 4
Minority interests 74 388
11,601 8,722
GROUP PERFORMANCE BOARD OF DIRECTORS’ REPORT 2015
FINANCIAL PERFORMANCE
80