Volvo 2015 Annual Report Download - page 121
Download and view the complete annual report
Please find page 121 of the 2015 Volvo annual report below. You can navigate through the pages in the report by either clicking on the pages listed below, or by using the keyword search tool below to find specific information within the annual report.-
 1
1 -
2
-
3
-
4
-
5
-
6
-
7
-
8
-
9
-
10
-
11
-
12
-
13
-
14
-
15
-
16
-
17
-
18
-
19
-
20
-
21
-
22
-
23
-
24
-
25
-
26
-
27
-
28
-
29
-
30
-
31
-
32
-
33
-
34
-
35
-
36
-
37
-
38
-
39
-
40
-
41
-
42
-
43
-
44
-
45
-
46
-
47
-
48
-
49
-
50
-
51
-
52
-
53
-
54
-
55
-
56
-
57
-
58
-
59
-
60
-
61
-
62
-
63
-
64
-
65
-
66
-
67
-
68
-
69
-
70
-
71
-
72
-
73
-
74
-
75
-
76
-
77
-
78
-
79
-
80
-
81
-
82
-
83
-
84
-
85
-
86
-
87
-
88
-
89
-
90
-
91
-
92
-
93
-
94
-
95
-
96
-
97
-
98
-
99
-
100
-
101
-
102
-
103
-
104
-
105
-
106
-
107
-
108
-
109
-
110
-
 111
111 -
 112
112 -
 113
113 -
 114
114 -
 115
115 -
 116
116 -
 117
117 -
 118
118 -
 119
119 -
 120
120 -
 121
121 -
 122
122 -
 123
123 -
 124
124 -
 125
125 -
 126
126 -
 127
127 -
 128
128 -
 129
129 -
 130
130 -
 131
131 -
132
-
133
-
134
-
135
-
136
-
137
-
138
-
139
-
140
-
141
-
142
-
143
-
144
-
145
-
146
-
147
-
148
-
149
-
150
-
151
-
152
-
153
-
154
-
155
-
156
-
157
-
158
-
159
-
160
-
161
-
162
-
163
-
164
-
165
-
166
-
167
-
168
-
169
-
170
-
171
-
172
-
173
-
174
-
175
-
176
-
177
-
178
-
179
-
180
-
181
-
182
-
183
-
184
-
185
-
186
-
187
-
188
-
189
-
190
-
191
-
192
-
193
-
194
-
195
-
196
-
197
-
198
-
199
-
200
-
201
-
202
-
203
-
204
 |
 |

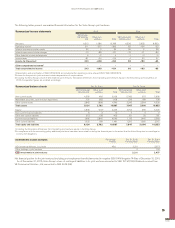
GROUP PERFORMANCE 2015 NOTES
4:4
Currency impact on operating income, Industrial Operations, SEK billion 2015 2014 Change
Net flows in foreign currency 4.3
Gains and losses on hedging contracts –0.0 –0.0 0.0
Unrealized gains and losses on receivables and liabilities in foreign currency –0.4 –0.2 –0.3
Currency effect from devaluation in Argentina and Venezuela –0.3 0.0 –0.3
Translation effect on operating income in foreign subsidiaries 1.3
Total currency impact on operating income 5.1
Currency impact on Net flows in foreign currency is detailed in table 4:6 and Translation effect on operating income in foreign subsidiaries is
detailed in table 4:7 in key currencies.
The Volvo Group’s currency review
When the Volvo Group communicates the currency impact on operating income for Industrial operations, the following factors are included:
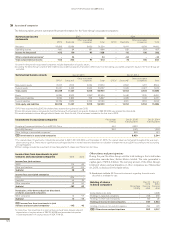
4:8
Currency effect on Net sales in 2015 versus 2014
18
15
12
–3
3
0
9
6
BRL
–1.3
EUR
2.0
GBP
2.2
JPY
1.1
USD
18.6
Other
4.3
Changes in currency rates compared to 2014 (Total SEK 27.0 bn).
Currency effect on Net sales from inflows in foreign currency and
translation effect when consolidating Net sales in foreign subsidiaries
for Industrial Operations is presented in the graph above.
SEK bn
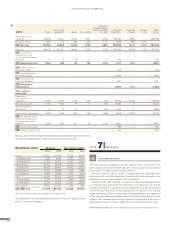
4:5
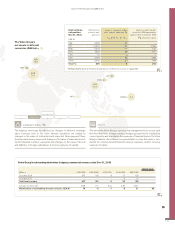
Transaction exposure from operating net flows in 2015 and 2014
4:6
Currency effect from Net flows in foreign currency
2015 versus 2014
4.0
3.5
2.5
2.0
3.0
1.5
1.0
–0.5
–1.0
0.5
0.0
GBP
1.1
USD
3.4
BRL
0.3
ZAR
0.2
EUR
–0.2
CAD
0.4
KRW
–1.0
Other
0
Changes in currency rates compared to 2014 (Total SEK 4.3 bn).
Currency effect on operating income from Net flows in foreign
currency in Industrial Operations is presented in the graph above.
SEK bn
4:7
Translation effect on operating income in foreign
subsidiaries in 2015 versus 2014
1.5
2.0
1.0
–0.5
0.5
0
BRL
–0.2
CNY
–0.2
EUR
0.0
GBP
–0.1
KRW
0.3
USD
1.6
Other
–0.1
Changes in currency rates compared to 2014 (Total SEK 1.3 bn).
Translation effect when consolidating operating income in foreign
subsidiaries for Industrial Operations is presented in the graph above.
SEK bn
SEK bn
–40
–30
–20
–10
0
10
20
9
Other
–39
SEK
–8
KRW
–2
EUR
–1
BRL
4
ZAR
5
CAD
9
GBP
19
11–33
–9
–4
33
4
NOK
43
6
16
USD
Currency flow 2015 Currency flow 2014
The graph above represents the transaction exposure from commercial
operating net cash flows in foreign currency, expressed as net surpluses or
deficits in key currencies. For further information read more in the section
Commercial currency exposure.
119