Volvo 2015 Annual Report Download - page 105
Download and view the complete annual report
Please find page 105 of the 2015 Volvo annual report below. You can navigate through the pages in the report by either clicking on the pages listed below, or by using the keyword search tool below to find specific information within the annual report.-
 1
1 -
2
-
3
-
4
-
5
-
6
-
7
-
8
-
9
-
10
-
11
-
12
-
13
-
14
-
15
-
16
-
17
-
18
-
19
-
20
-
21
-
22
-
23
-
24
-
25
-
26
-
27
-
28
-
29
-
30
-
31
-
32
-
33
-
34
-
35
-
36
-
37
-
38
-
39
-
40
-
41
-
42
-
43
-
44
-
45
-
46
-
47
-
48
-
49
-
50
-
51
-
52
-
53
-
54
-
55
-
56
-
57
-
58
-
59
-
60
-
61
-
62
-
63
-
64
-
65
-
66
-
67
-
68
-
69
-
70
-
71
-
72
-
73
-
74
-
75
-
76
-
77
-
78
-
79
-
80
-
81
-
82
-
83
-
84
-
85
-
86
-
87
-
88
-
89
-
90
-
91
-
92
-
93
-
94
-
 95
95 -
 96
96 -
 97
97 -
 98
98 -
 99
99 -
 100
100 -
 101
101 -
 102
102 -
 103
103 -
 104
104 -
 105
105 -
 106
106 -
 107
107 -
 108
108 -
 109
109 -
 110
110 -
 111
111 -
 112
112 -
 113
113 -
 114
114 -
 115
115 -
116
-
117
-
118
-
119
-
120
-
121
-
122
-
123
-
124
-
125
-
126
-
127
-
128
-
129
-
130
-
131
-
132
-
133
-
134
-
135
-
136
-
137
-
138
-
139
-
140
-
141
-
142
-
143
-
144
-
145
-
146
-
147
-
148
-
149
-
150
-
151
-
152
-
153
-
154
-
155
-
156
-
157
-
158
-
159
-
160
-
161
-
162
-
163
-
164
-
165
-
166
-
167
-
168
-
169
-
170
-
171
-
172
-
173
-
174
-
175
-
176
-
177
-
178
-
179
-
180
-
181
-
182
-
183
-
184
-
185
-
186
-
187
-
188
-
189
-
190
-
191
-
192
-
193
-
194
-
195
-
196
-
197
-
198
-
199
-
200
-
201
-
202
-
203
-
204
 |
 |

GROUP PERFORMANCE BOARD OF DIRECTORS’ REPORT 2015
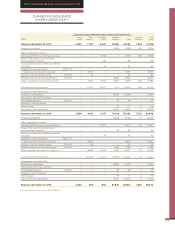
CHANGES IN CONSOLIDATED
SHAREHOLDERS’ EQUITY
Shareholders’ equity attributable to equity holders of the Parent Company
SEK M
Share
capital
Other
reserves
1
Translation
reserve
Retained
earnings Total
Minority
interests
Total
equity
Balance at December 31, 2013 2,554 1,037 –4,440 76,881 76,032 1,333 77,365
Income for the period – – – 2,099 2,099 136 2,235
Other comprehensive income
Translation differences on foreign operations – – 5,746 – 5,746 252 5,998
Share of OCI related to Joint Ventures
and associated companies – – 198 – 198 – 198
Accumulated translation differences reversed
to income – – 33 – 33 – 33
Available-for-sale investments: Note 5, 19
Gains/losses at valuation to fair value – 3,067 – – 3,067 – 3,067
Change incash flow hedge reserve Note 19 – 24 – – 24 – 24
Remeasurements of defined benefit plans Note 20 – – – –2,833 –2,833 – –2,833
Other comprehensive income for the period – 3,091 5,977 –2,833 6,235 252 6,487
Total income for the period – 3,091 5,977 –734 8,334 388 8,722
Transactions with shareholders
Dividends to shareholders – – – –6,084 –6,084 – –6,084
Transactions with minority interests –– – ––––
Share based payments Note 27 – – – 60 60 – 60
Changes in minority interests –– – ––––
Other changes – – – –17 –17 2 –15
Transactions with shareholders – – – –6,041 –6,041 2 –6,039
Balance at December 31, 2014 2,554 4,128 1,537 70,106 78,325 1,723 80,048
Income for the period – – – 15,058 15,058 41 15,099
Other comprehensive income
Translation differences on foreign operations – – –2,515 – –2,515 33 –2,481
Share of OCI related to Joint Ventures
and associated companies – – – 24 24 – 24
Accumulated translation differences reversed
to income ––45 –45–45
Available-for-sale investments: Note 5, 19
Gains/losses at valuation to fair value – –3,837 – – –3,837 – –3,837
Change incash flow hedge reserve Note 19 – –32 – – –32 – –32
Remeasurements of defined benefit plans Note 20 – – – 2,783 2,783 – 2,783
Other comprehensive income for the period – –3,869 –2,470 2,807 –3,533 33 –3,498
Total income for the period – –3,869 –2,470 17,865 11,527 74 11,601
Transactions with shareholders
Dividends to shareholders – – – –6,090 –6,090 – –6,090
Transactions with minority interests –– – ––––
Share based payments Note 27 – – – 65 65 – 65
Changes in minority interests –– – ––––
Other changes – – – –17 –17 4 –14
Transactions with shareholders – – – –6,041 –6,041 4 –6,037
Balance at December 31, 2015 2,554 259 –933 81,930 83,810 1,801 85,610
1 For specification of other reserves, refer to Note 19.
103