Volvo 2015 Annual Report Download - page 148
Download and view the complete annual report
Please find page 148 of the 2015 Volvo annual report below. You can navigate through the pages in the report by either clicking on the pages listed below, or by using the keyword search tool below to find specific information within the annual report.-
 1
1 -
2
-
3
-
4
-
5
-
6
-
7
-
8
-
9
-
10
-
11
-
12
-
13
-
14
-
15
-
16
-
17
-
18
-
19
-
20
-
21
-
22
-
23
-
24
-
25
-
26
-
27
-
28
-
29
-
30
-
31
-
32
-
33
-
34
-
35
-
36
-
37
-
38
-
39
-
40
-
41
-
42
-
43
-
44
-
45
-
46
-
47
-
48
-
49
-
50
-
51
-
52
-
53
-
54
-
55
-
56
-
57
-
58
-
59
-
60
-
61
-
62
-
63
-
64
-
65
-
66
-
67
-
68
-
69
-
70
-
71
-
72
-
73
-
74
-
75
-
76
-
77
-
78
-
79
-
80
-
81
-
82
-
83
-
84
-
85
-
86
-
87
-
88
-
89
-
90
-
91
-
92
-
93
-
94
-
95
-
96
-
97
-
98
-
99
-
100
-
101
-
102
-
103
-
104
-
105
-
106
-
107
-
108
-
109
-
110
-
111
-
112
-
113
-
114
-
115
-
116
-
117
-
118
-
119
-
120
-
121
-
122
-
123
-
124
-
125
-
126
-
127
-
128
-
129
-
130
-
131
-
132
-
133
-
134
-
135
-
136
-
137
-
 138
138 -
 139
139 -
 140
140 -
 141
141 -
 142
142 -
 143
143 -
 144
144 -
 145
145 -
 146
146 -
 147
147 -
 148
148 -
 149
149 -
 150
150 -
 151
151 -
 152
152 -
 153
153 -
 154
154 -
 155
155 -
 156
156 -
 157
157 -
 158
158 -
159
-
160
-
161
-
162
-
163
-
164
-
165
-
166
-
167
-
168
-
169
-
170
-
171
-
172
-
173
-
174
-
175
-
176
-
177
-
178
-
179
-
180
-
181
-
182
-
183
-
184
-
185
-
186
-
187
-
188
-
189
-
190
-
191
-
192
-
193
-
194
-
195
-
196
-
197
-
198
-
199
-
200
-
201
-
202
-
203
-
204
 |
 |
146
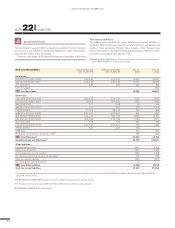
GROUP PERFORMANCE 2015 NOTES
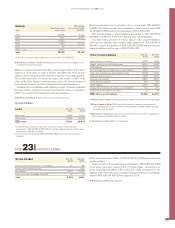
Non-current liabilities Actual interest rate
Dec 31, 2015, % Effective interest rate
Dec 31, 2015, % Dec31,
2015 Dec 31,
2014
Bond loans
EUR 2007-2014/2017-2078 0.33–5.04 0.33–5.04 34,525 44,062
SEK 2007-2015/2017-2019 0.26–3.39 0.26–3.39 12,557 23,562
JPY 2014/2017 0.60 0.60 693 784
USD 2013/2016 –469
B/S Total Bond loans147,776 68,877
Other loans
USD 2008-2015/2017-2024 0.54–3.00 0.54–3.00 6,766 9,852
EUR 2007-2014/2017-2027 1.29–6.5 1.29–6.50 1,753 1,869
GBP 2002/2027 11.11 11.68 61 59
SEK 2007-2014/2017-2034 0.00 0.00 208 2,055
CAD 2015/2017 1.17–2.15 1.76–2.18 754 874
MXN 2014-2015/2017-2020 4.20–4.50 4.42–4.59 981 1,233
JPY 2009-2015/2017-2024 0.44–1.34 0.44–1.35 9,509 12,701
BRL 2010-2013/2019-2025 3.14–7.99 3.23–7.99 5,468 7,517
AUD 2015/2019 3.08 3.12 220 319
CNY 2012-2013/2017-2018 4.30–5.21 4.30–5.21 508 1,486
THB 2015/2017 2.46 2.49 348 –
Other loans 340 653
Revaluation of outstanding derivatives to SEK2585 536
B/S Total Other loans127,500 39,154
Total Bond loans and Other loans375,275 108,031
Other liabilities
Deferred leasing income 2,615 2,364
Residual value liabilities 4,939 4,586
Accrued expenses service contracts 7,256 5,498
Outstanding interest and currency risk derivatives2181275
Other non-current liabilities 1,529 1,004
Outstanding raw material derivatives 18 5
B/S Total Other liabilities 16,538 13,732
Total non-current liabilities 91,813 121,763
1 Of which loans raised to finance the credit portfolio of the Customer Finance Operations amounted to SEK 25,238 M (44,620) in Bond loans and SEK 29,263 M
(28,348) in Other loans.
2 Read more in Note 30 Financial Instruments, table Carrying amounts and fair values.
3 Of the above non-current loans, SEK 5,926 M (4,478) were secured by assets pledged.
Read more in Note 23 Assets pledged.
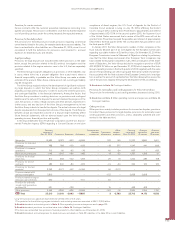
The hybrid bond issued in 2014 is classified as debt in the Volvo Group’s
accounts as it constitutes a contractual obligation to make interest pay-
ments to the holder of the instrument.
The terms and details of the hybrid bond are described later in this note.
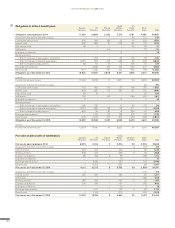
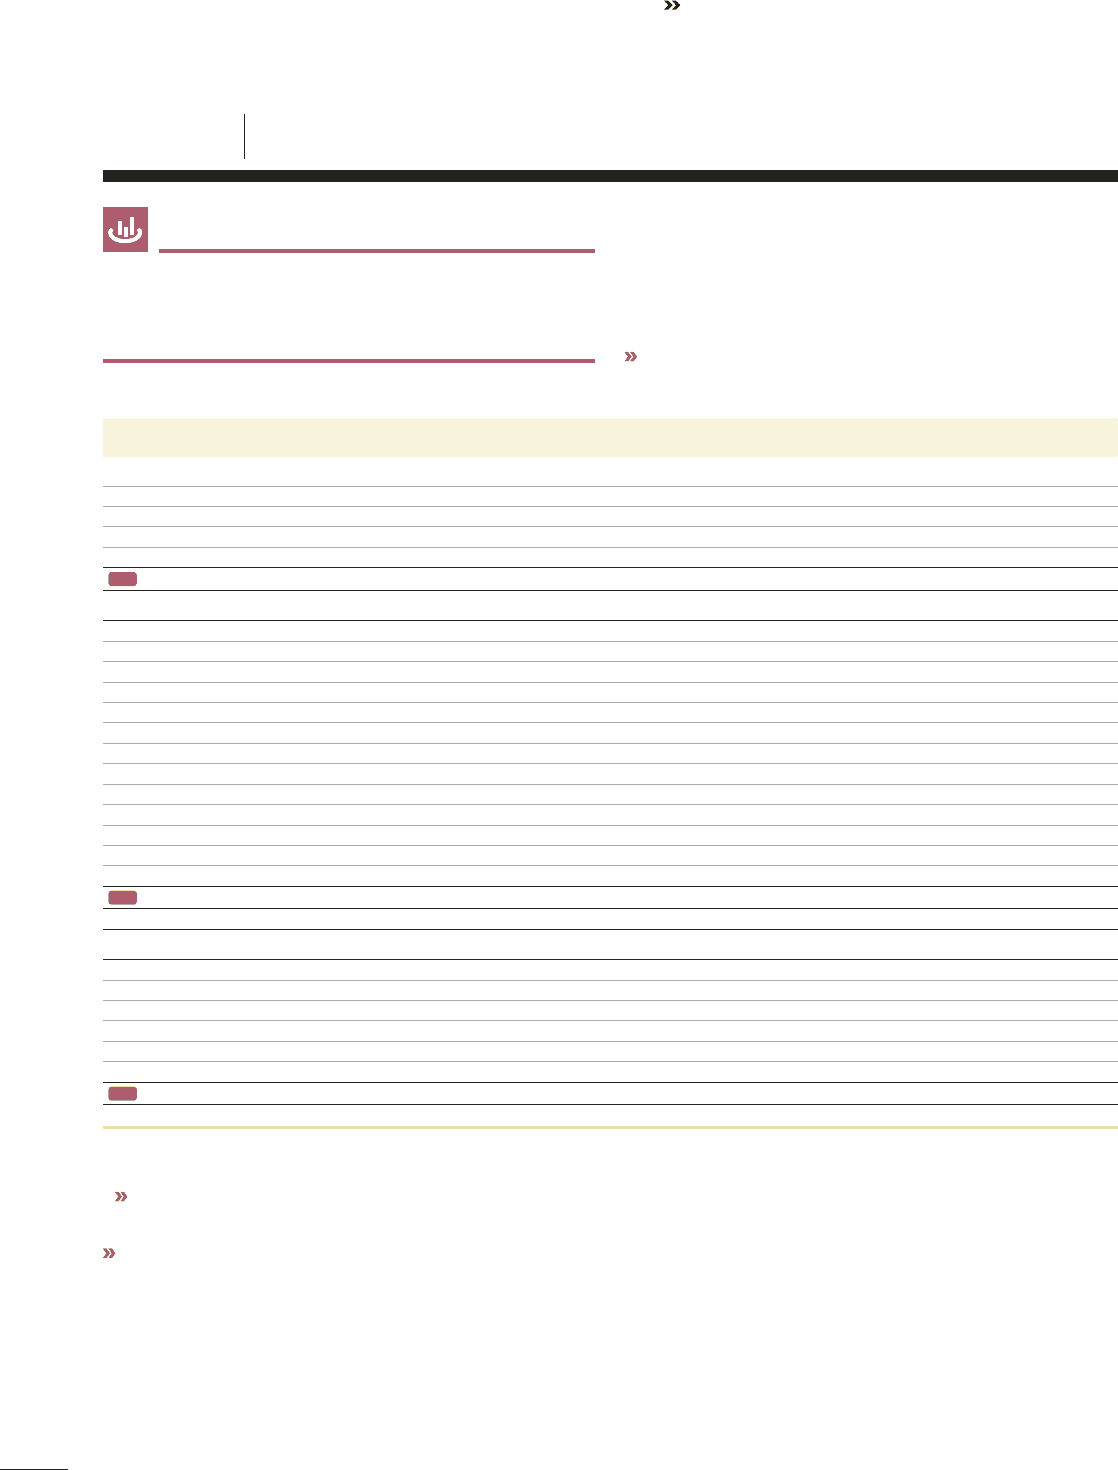
Non-current liabilities
The tables below disclose the Volvo Group’s non-current liabilities in
which the largest loans are listed by currency. Loans in subsidiaries are
mainly in local currencies through Volvo Treasury. Volvo Treasury uses
various derivatives to facilitate lending and borrowing in different curren-
cies without increasing Volvo Group’s risk.
Read more in Note 4 about Goals and policies in financial risk management
and in Note 30 about Financial Instruments.
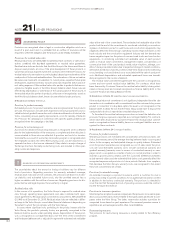
NOTE 22 LIABILITIES
ACCOUNTING POLICY