Volvo 2015 Annual Report Download - page 135
Download and view the complete annual report
Please find page 135 of the 2015 Volvo annual report below. You can navigate through the pages in the report by either clicking on the pages listed below, or by using the keyword search tool below to find specific information within the annual report.-
 1
1 -
2
-
3
-
4
-
5
-
6
-
7
-
8
-
9
-
10
-
11
-
12
-
13
-
14
-
15
-
16
-
17
-
18
-
19
-
20
-
21
-
22
-
23
-
24
-
25
-
26
-
27
-
28
-
29
-
30
-
31
-
32
-
33
-
34
-
35
-
36
-
37
-
38
-
39
-
40
-
41
-
42
-
43
-
44
-
45
-
46
-
47
-
48
-
49
-
50
-
51
-
52
-
53
-
54
-
55
-
56
-
57
-
58
-
59
-
60
-
61
-
62
-
63
-
64
-
65
-
66
-
67
-
68
-
69
-
70
-
71
-
72
-
73
-
74
-
75
-
76
-
77
-
78
-
79
-
80
-
81
-
82
-
83
-
84
-
85
-
86
-
87
-
88
-
89
-
90
-
91
-
92
-
93
-
94
-
95
-
96
-
97
-
98
-
99
-
100
-
101
-
102
-
103
-
104
-
105
-
106
-
107
-
108
-
109
-
110
-
111
-
112
-
113
-
114
-
115
-
116
-
117
-
118
-
119
-
120
-
121
-
122
-
123
-
124
-
 125
125 -
 126
126 -
 127
127 -
 128
128 -
 129
129 -
 130
130 -
 131
131 -
 132
132 -
 133
133 -
 134
134 -
 135
135 -
 136
136 -
 137
137 -
 138
138 -
 139
139 -
 140
140 -
 141
141 -
 142
142 -
 143
143 -
 144
144 -
 145
145 -
146
-
147
-
148
-
149
-
150
-
151
-
152
-
153
-
154
-
155
-
156
-
157
-
158
-
159
-
160
-
161
-
162
-
163
-
164
-
165
-
166
-
167
-
168
-
169
-
170
-
171
-
172
-
173
-
174
-
175
-
176
-
177
-
178
-
179
-
180
-
181
-
182
-
183
-
184
-
185
-
186
-
187
-
188
-
189
-
190
-
191
-
192
-
193
-
194
-
195
-
196
-
197
-
198
-
199
-
200
-
201
-
202
-
203
-
204
 |
 |

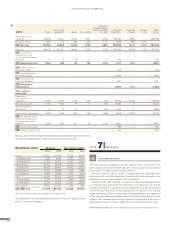
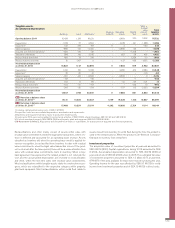
Reclassifications and other mainly consist of assets within sales with
residual value commitments related to legal sales transactions, where rev-
enue is deferred and accounted for as operating lease revenue. Assets
classified as inventory will, when the operating lease model is applied for
revenue recognition, be reclassified from inventory to sales with residual
value commitments, when the legal sales transaction occurs. If the prod-
uct is returned after the lease period, there will be a reclassification from
sales with residual value commitments back to inventory. When a buy-
back agreement has expired, but the related product is not returned, the
cost and the accumulated depreciation are reversed in reclassification
and other, within the line item sales with residual value commitments.
Most reclassifications within tangible assets relate to construction in pro-
gress, which are reclassified to the respective category within property,
plant and equipment. Most reclassifications within rental fleet relate to
assets moved from inventory to rental fleet during the time the product is
used in the rental business. When the product is de-fleeted it is reclassi-
fied back to inventory from rental fleet.
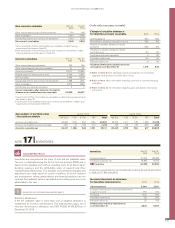
Investment properties
The acquisition value of investment properties at year-end amounted to
SEK 692 M (600). Capital expenditures during 2015 amounted to SEK
6 M (3). Accumulated depreciation amounted to SEK 409 M (335) at
year-end, of which SEK 26 M (23) refers to 2015. The estimated fair value
of investment properties amounted to SEK 1.0 billion (0.7) at year-end.
97% (97) of the area available for lease were leased out during the year.
Operating income for the year was affected by SEK 97 M (78) in rental
income from investment properties and of SEK 19 M (13) in direct costs.
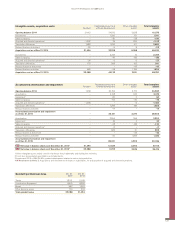
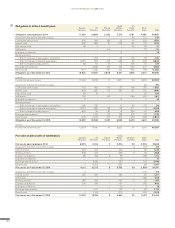
Tangible assets,
Accumulated depreciation
Buildings Land Machinery3Ongoing
projects Operating
leases Rental
fleet
Sales w.
residual
value
commit-
ments
Total
tangible
assets
Opening balance 2014 15,428 1,124 49,129 – 6,469 330 3,252 75,732
Depreciation 1,168 77 4,804 – 3,478 341 1,988 11, 856
Impairment4140 318 197 11 3 – –130 540
Sales/scrapping –689 –49 –4,430 – –2,666 –43 – –7,878
Acquired and divested operations
6–622 –36 –20 – – –1,306 – –1,984
Translation differences 928 66 2,795 – 657 28 457 4,932
Reclassified at divestment 459 14 219 – – 1,224 –10 1,906
Reclassifications and other 10 –367 0 – –137 –166 –1,605 –2,266
Accumulated depreciation
as of Dec 31, 2014 16,822 1,147 52,694 11 7,803 409 3,952 82,839
Depreciation 1,310 85 5,008 – 4,386 470 2,289 13,548
Impairment425 26 –10 – – – –124 –84
Sales/scrapping –391 –26 –3,523 – –3,536 – 0 –7,476
Acquired and divested operations
6–147 – –56 – – –1 – –203
Translation differences 103 6 99 – –41 –37 –121 10
Reclassified at divestment –133 –21 –717 – – –132 10 –994
Reclassifications and other –243 –20 –214 – –727 113 –2,203 –3,294
Accumulated depreciation
as of Dec 31, 2015 17,347 1,198 53,281 11 7,884 821 3,802 84,345
B/S Net value in balance sheet
as of Dec 31, 20142, 5 17,131 10,535 23,337 4 ,179 19,228 1,153 10,837 86, 399
B/S Net value in balance sheet
as of Dec 31, 20152, 5 17,488 10,324 21,514 4,292 18,693 2,724 11,114 86,149
1 Including capitalized borrowing costs of SEK 0 M (160).
2 Acquisition costs less accumulated depreciation, amortization and impairments.
3 Machinery and equipment pertains mainly to production related assets.
4 Impairments 2014 were mainly related to restructuring activities of SEK 459 M, whereof buildings SEK 140 M, land SEK 319 M.
5 Of which investment property SEK 283 M (266) and property, plant and equipment SEK 53,335 M (54,915).
6 Read more in Note 3, Acquisitions and divestments of shares in subsidiaries, for a description of acquired and divested operations.
GROUP PERFORMANCE 2015 NOTES
133