Volvo 2015 Annual Report Download - page 88
Download and view the complete annual report
Please find page 88 of the 2015 Volvo annual report below. You can navigate through the pages in the report by either clicking on the pages listed below, or by using the keyword search tool below to find specific information within the annual report.-
 1
1 -
2
-
3
-
4
-
5
-
6
-
7
-
8
-
9
-
10
-
11
-
12
-
13
-
14
-
15
-
16
-
17
-
18
-
19
-
20
-
21
-
22
-
23
-
24
-
25
-
26
-
27
-
28
-
29
-
30
-
31
-
32
-
33
-
34
-
35
-
36
-
37
-
38
-
39
-
40
-
41
-
42
-
43
-
44
-
45
-
46
-
47
-
48
-
49
-
50
-
51
-
52
-
53
-
54
-
55
-
56
-
57
-
58
-
59
-
60
-
61
-
62
-
63
-
64
-
65
-
66
-
67
-
68
-
69
-
70
-
71
-
72
-
73
-
74
-
75
-
76
-
77
-
 78
78 -
 79
79 -
 80
80 -
 81
81 -
 82
82 -
 83
83 -
 84
84 -
 85
85 -
 86
86 -
 87
87 -
 88
88 -
 89
89 -
 90
90 -
 91
91 -
 92
92 -
 93
93 -
 94
94 -
 95
95 -
 96
96 -
 97
97 -
 98
98 -
99
-
100
-
101
-
102
-
103
-
104
-
105
-
106
-
107
-
108
-
109
-
110
-
111
-
112
-
113
-
114
-
115
-
116
-
117
-
118
-
119
-
120
-
121
-
122
-
123
-
124
-
125
-
126
-
127
-
128
-
129
-
130
-
131
-
132
-
133
-
134
-
135
-
136
-
137
-
138
-
139
-
140
-
141
-
142
-
143
-
144
-
145
-
146
-
147
-
148
-
149
-
150
-
151
-
152
-
153
-
154
-
155
-
156
-
157
-
158
-
159
-
160
-
161
-
162
-
163
-
164
-
165
-
166
-
167
-
168
-
169
-
170
-
171
-
172
-
173
-
174
-
175
-
176
-
177
-
178
-
179
-
180
-
181
-
182
-
183
-
184
-
185
-
186
-
187
-
188
-
189
-
190
-
191
-
192
-
193
-
194
-
195
-
196
-
197
-
198
-
199
-
200
-
201
-
202
-
203
-
204
 |
 |

T
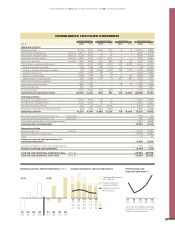
he cash flow within Industrial Operations was pos-
itively affected by an operating income of SEK
21.3 billion. In addition, the cash flow has been
positively impacted by higher depreciations than
investments in an amount of SEK 3.5 billion. This
was offset by an increase in working capital of
SEK 2.0 billion mainly as an effect of increased inventories and
decreased trade payables.
Financial items and paid income taxes had a SEK 4.1 billion
negative effect on the cash flow within Industrial Operations,
mainly through payments of interests and income tax.
Operating cash flow within Customer Finance was negative
SEK 5.9 billion (5.3), mainly due to increased customer-financing
receivables and investment in leasing vehicles.
Investments
The Industrial Operations’ investments in fixed assets and capital-
ized research and development during 2015 amounted to SEK
8.8 billion (8.6).
In Group Trucks investments in fixed assets and capitalized R&D
amounted to SEK 6.3 billion (5.7). The investments were mainly
related to industrial efficiency measures in our plants, with the con-
tinuation of the European optimization program as well as rational-
izations in our US plants, primarily a more streamlined assembly
process implemented in the engine plant in Hagerstown.
Investments in optimization of the global services footprints as
well as investments in Köping have also increased, in order to
increase capacity for the Volvo Group’s automated manual trans-
mission. Capital expenditures were also related to investments to
comply with new emission regulations in US and Japan, with both
product development activities and required adaptations in the
plants.
The investments in dealer networks and workshops were
mainly done in Europe and Japan, primarily for upgrade and
replacements.
Investments in Construction Equipment amounted to SEK 1.1
billion (1.3). The product related investments during the year con-
tinued and were mainly related to adaptions to the Tier 4 Final/
Stage IV, the latest emissions regulations in North America and
Europe. There were also investments in the plants related to prod-
uct renewals and required adaptions mainly in Asia and Europe.
The investments in Volvo Buses were SEK 0.3 billion (0.3), and
in Volvo Penta SEK 0.3 billion (0.3).
Total investments in leasing assets during 2015 amounted to
SEK 0.3 billion (0.5).
The investment level for property, plant and equipment during
2015 was lower than previous years. During 2016, investments in
property, plant and equipment are expected to be on the same
level as in 2015. The optimization of the industrial and logistic
footprint, dealer investments and product related tooling will con-
tinue to be the main areas.
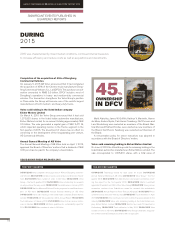
Investments and divestments of shares
The acquisition of 45% of shares in Dongfeng Commercial Vehi-
cles Co., Ltd, (DFCV) in China was completed in the beginning of
January 2015.
Part of the shares in the listed Indian automotive manufacturer,
Eicher Motors Limited was sold on March 4, 2015. The remaining
holding of shares in the listed company was sold on June 4, 2015.
In total investments and divestments of shares, net in 2015
had a negative impact on cash flow of SEK 2.0 billion (0.1).
Read more in Note 5 regarding Investments in joint venture, associated
companies and other shares and participations.
Acquired and divested operations
The Volvo Group has not made any acquisitions or divestments
during 2015, which solely or jointly have had a significant impact
on the Volvo Group’s financial statements.
In total acquired and divested operations in 2015 had a positive
impact on cash flow of SEK 0.4 billion (7,4).
Read more in Note 3 regarding Acquisitions and divestments of
shares in subsidiaries.
Financing and dividend
Net borrowings decreased cash and cash equivalents by SEK 13.2
billion during 2015. In 2014 the corresponding item increased
cash and cash eqivalents by SEK 6,7 billion.
Read more in Note 29 Cash flow regarding movements during the
year on the net borrowings.
During the year dividend of SEK 6.1 billion, corresponding to SEK
3.00 per share, was paid to the shareholders of AB Volvo.
Change in cash and cash equivalents
The Volvo Group’s cash and cash equivalents decreased by SEK
5.2 billion during the year and amounted to SEK 21.0 billion at
December 31, 2015.
Read more in Note 29 Cash flow regarding principles for preparing
the cash flow statement.
Read more in Note 18 regarding the accounting policy for Marketable
securities and liquid funds.
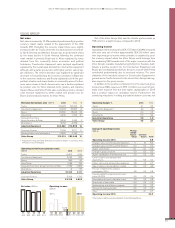
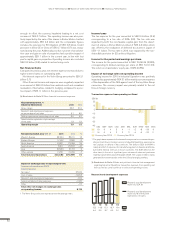
During 2015, operating cash flow in the Industrial Operations amounted to a positive SEK 18.3 billion (6.4).
STRONG OPERATING
CASH FLOW
GROUP PERFORMANCE BOARD OF DIRECTORS’ REPORT 2015
CASH FLOW STATEMENT
86