Volvo 2015 Annual Report Download - page 143
Download and view the complete annual report
Please find page 143 of the 2015 Volvo annual report below. You can navigate through the pages in the report by either clicking on the pages listed below, or by using the keyword search tool below to find specific information within the annual report.-
 1
1 -
2
-
3
-
4
-
5
-
6
-
7
-
8
-
9
-
10
-
11
-
12
-
13
-
14
-
15
-
16
-
17
-
18
-
19
-
20
-
21
-
22
-
23
-
24
-
25
-
26
-
27
-
28
-
29
-
30
-
31
-
32
-
33
-
34
-
35
-
36
-
37
-
38
-
39
-
40
-
41
-
42
-
43
-
44
-
45
-
46
-
47
-
48
-
49
-
50
-
51
-
52
-
53
-
54
-
55
-
56
-
57
-
58
-
59
-
60
-
61
-
62
-
63
-
64
-
65
-
66
-
67
-
68
-
69
-
70
-
71
-
72
-
73
-
74
-
75
-
76
-
77
-
78
-
79
-
80
-
81
-
82
-
83
-
84
-
85
-
86
-
87
-
88
-
89
-
90
-
91
-
92
-
93
-
94
-
95
-
96
-
97
-
98
-
99
-
100
-
101
-
102
-
103
-
104
-
105
-
106
-
107
-
108
-
109
-
110
-
111
-
112
-
113
-
114
-
115
-
116
-
117
-
118
-
119
-
120
-
121
-
122
-
123
-
124
-
125
-
126
-
127
-
128
-
129
-
130
-
131
-
132
-
 133
133 -
 134
134 -
 135
135 -
 136
136 -
 137
137 -
 138
138 -
 139
139 -
 140
140 -
 141
141 -
 142
142 -
 143
143 -
 144
144 -
 145
145 -
 146
146 -
 147
147 -
 148
148 -
 149
149 -
 150
150 -
 151
151 -
 152
152 -
 153
153 -
154
-
155
-
156
-
157
-
158
-
159
-
160
-
161
-
162
-
163
-
164
-
165
-
166
-
167
-
168
-
169
-
170
-
171
-
172
-
173
-
174
-
175
-
176
-
177
-
178
-
179
-
180
-
181
-
182
-
183
-
184
-
185
-
186
-
187
-
188
-
189
-
190
-
191
-
192
-
193
-
194
-
195
-
196
-
197
-
198
-
199
-
200
-
201
-
202
-
203
-
204
 |
 |

GROUP PERFORMANCE 2015 NOTES
141
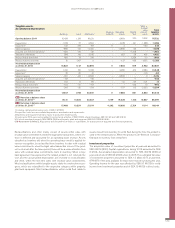
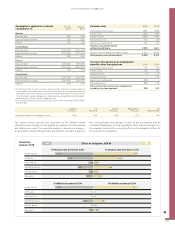
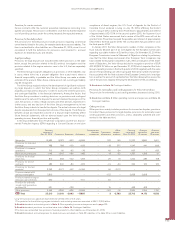
Assumptions applied for actuarial
calculations, % Dec 31,
2015 Dec 31,
2014
Sweden
Discount rate13.50 2.75
Expected salary increase 2.90 3.00
Inflation 1.50 1.50
United States
Discount rate1 2 3.00–4.40 2.50–4.30
Expected salary increase 2.70–3.50 2.70–3.50
Inflation 2.20 2.50
France
Discount rate11.50–2.20 1.50–2.00
Expected salary increase 2.50–3.00 2.50–3.00
Inflation 1.50 1.50
Great Britain
Discount rate13.50–3.80 3.50–3.75
Expected salary increases 3.50–3.60 3.60–3.70
Inflation 3.10 3.00
1 The discount rate for each country is determined by reference to market yields on
high-quality corporate bonds. In countries where there is no functioning market in
such bonds, the market yields on government bonds are used. The discount rate
for the Swedish pension obligation is determined by extrapolating current market
rates along the yield curve of mortgage bonds.
2 For all plans except two the discount rate used is within the range 3.70–4.40%
(3.60–4.30).
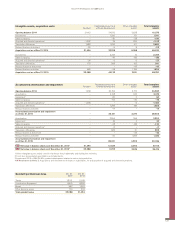
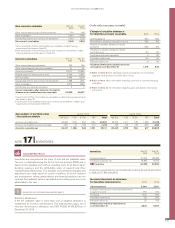
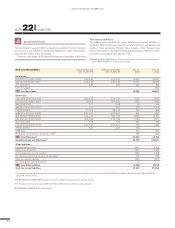
Pension costs 2015 2014
Current year service costs 1,681 1,298
Interest costs 1,532 1,479
Interest income –1,208 –1,180
Past service costs 122 58
Gain/loss on settlements –129 –54
Pension costs for the period,
defined-benefit plans 1,999 1,601
Pension costs for defined-contribution plans 2,340 2,530
Total pension costs for the period 4,339 4,131
Costs for the period, post–employment
benefits other than pensions 2015 2014
Current year service costs 121 56
Interest costs 147 141
Interest income –3 –2
Past service costs – –37
Gain/loss on settlements –185 –
Remeasurements 248 –55
Total costs for the period, post–employment
benefits other than pensions 328 103
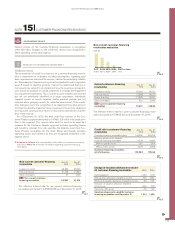
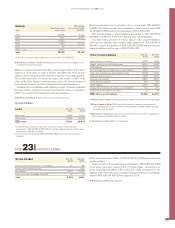
− +
Effect on obligation, SEK M
If discount rate increases 0.5% If discount rate decreases 0.5%
Sweden Pensions
Sweden Pensions
US Pensions
US Pensions
US Other benefits
US Other benefits
Other plants
Other plants
France Pensions
France Pensions
Great Britain Pensions
Great Britain Pensions
If inflation decreases 0.5% If inflation increases 0.5%
–1,344
–918
–176
1,537
1,013
190
–561
–169
648
185
–273 310
–1,344 1,537
0
–4
0
4
–385
–16 18
–165 188
393
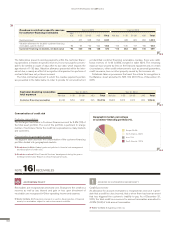
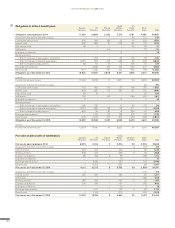
Sweden
Pensions US
Pensions France
Pensions Great Britain
Pensions US
Other benefits
Average duration of the obligation, years 21.6 10.5 14.8 17.7 10.2
The analysis below presents the sensitivity on the defined benefit
obligations when changes in the applied assumptions for discount rate
and inflation are made. The sensitivity analysis is based on a change in
an assump tion while holding all other assumptions constant. In practice,
thisis not probable, and changes in some of the assumptions may be
correlated. Depending on local regulations, facts and circumstances in
the separate countries the sensitivity effect on the obligation differs for
the respective assumptions.
Sensitivity
analysis 2015