Volvo 2015 Annual Report Download - page 118
Download and view the complete annual report
Please find page 118 of the 2015 Volvo annual report below. You can navigate through the pages in the report by either clicking on the pages listed below, or by using the keyword search tool below to find specific information within the annual report.-
 1
1 -
2
-
3
-
4
-
5
-
6
-
7
-
8
-
9
-
10
-
11
-
12
-
13
-
14
-
15
-
16
-
17
-
18
-
19
-
20
-
21
-
22
-
23
-
24
-
25
-
26
-
27
-
28
-
29
-
30
-
31
-
32
-
33
-
34
-
35
-
36
-
37
-
38
-
39
-
40
-
41
-
42
-
43
-
44
-
45
-
46
-
47
-
48
-
49
-
50
-
51
-
52
-
53
-
54
-
55
-
56
-
57
-
58
-
59
-
60
-
61
-
62
-
63
-
64
-
65
-
66
-
67
-
68
-
69
-
70
-
71
-
72
-
73
-
74
-
75
-
76
-
77
-
78
-
79
-
80
-
81
-
82
-
83
-
84
-
85
-
86
-
87
-
88
-
89
-
90
-
91
-
92
-
93
-
94
-
95
-
96
-
97
-
98
-
99
-
100
-
101
-
102
-
103
-
104
-
105
-
106
-
107
-
 108
108 -
 109
109 -
 110
110 -
 111
111 -
 112
112 -
 113
113 -
 114
114 -
 115
115 -
 116
116 -
 117
117 -
 118
118 -
 119
119 -
 120
120 -
 121
121 -
 122
122 -
 123
123 -
 124
124 -
 125
125 -
 126
126 -
 127
127 -
 128
128 -
129
-
130
-
131
-
132
-
133
-
134
-
135
-
136
-
137
-
138
-
139
-
140
-
141
-
142
-
143
-
144
-
145
-
146
-
147
-
148
-
149
-
150
-
151
-
152
-
153
-
154
-
155
-
156
-
157
-
158
-
159
-
160
-
161
-
162
-
163
-
164
-
165
-
166
-
167
-
168
-
169
-
170
-
171
-
172
-
173
-
174
-
175
-
176
-
177
-
178
-
179
-
180
-
181
-
182
-
183
-
184
-
185
-
186
-
187
-
188
-
189
-
190
-
191
-
192
-
193
-
194
-
195
-
196
-
197
-
198
-
199
-
200
-
201
-
202
-
203
-
204
 |
 |
BRL
6.0
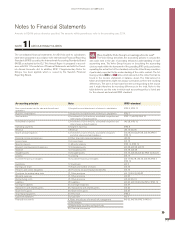
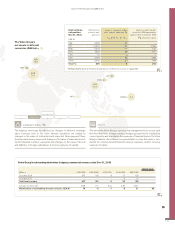
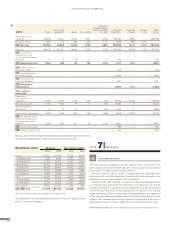
The Volvo Group’s global operations expose the Group to financial risks in
the form of interest rate risks, currency risks, credit risks, liquidity risks
and other price risks. Work on financial risks comprises an integrated
element of the Volvo Group’s business. The Volvo Group strive to minimize
these risks by optimizing the Group’s capital costs by utilizing economies
of scale, minimize negative effects on income as a result of changes in
currency or interest rates and to minimize risk exposure. All risks are man-
aged pursuant to the Volvo Group’s established policies in these areas.
Read more about accounting principles for financial instruments in Note 30,
Financial Instruments.
Read more about management of capital on page 101 and page 102.
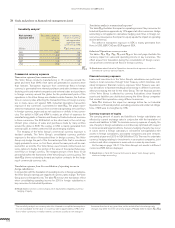
INTEREST-RATE RISKS A
Interest-rate risk refers to the risk that changed interest-rate will affect
the Volvo Group’s consolidated earnings and cash flow (cash-flow risks) or
the fair value of financial assets and liabilities (price risks).
POLICY
Matching the interest-fixing terms of financial assets and liabilities
reduces the exposure. Interest-rate swaps are used to change/influence
the interest-fixing term for the Volvo Group’s financial assets and liabili-
ties. Currency interest-rate swaps enable borrowing in foreign currencies
from different markets without introducing currency risk. The Volvo Group
has also standardized interest-rate forward contracts (futures) and FRAs
(forward-rate agreements). Most of these contracts are used to hedge
interest-rate levels for short-term borrowing or investments.
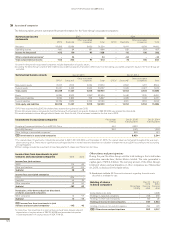
Cash-flow risks
The effect of changed interest rate levels on future currency and interest-
rate flows primarily pertains to the Volvo Group’s Customer Finance Oper-
ations and net financial items. Customer Finance Operations measure the
degree of matching interest rate fixing on borrowing and lending. The
calculation of the matching degree excludes equity, which amounted to
between 8 and 9% in the Customer Finance Operations. At year-end
2015, the degree of such matching was 99% (101) for the segment
Customer Finance, which was in line with the Volvo Group’s policy. The
centralized Treasury function has, for practical as well as business rea-
sons, the mandate to mismatch the Customer Finance portfolio down to a
matching ratio of 80%. At year-end 2015, the matching ratio was 91%
(110). Any gains or losses from the mismatch impact the segment Group
functions and other within Industrial Operations. At year-end 2015, in
addition to the assets in its Customer Finance Operations, the Volvo
Group’s interest-bearing assets consisted primarily of cash, cash equiva-
lents and liquid assets invested in short-term interest-bearing securities.
The objective for the Volvo Group’s short-term interest-bearing securities
is to achieve a return on these assets equivalent to a three-month fixed
term security. On December 31, 2015, the average interest on Industrial
Operations financial assets was 0.6% (0.9). After taking derivatives into
account, outstanding loans had interest terms corresponding to a short
term interest-rate fixing term, between one to three months. The average
interest on Industrial Operations financial liabilities at year-end amounted
to 4.3% (3.8), including the Volvo Group’s credit costs.
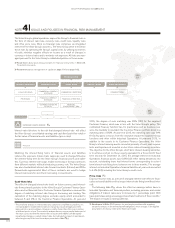
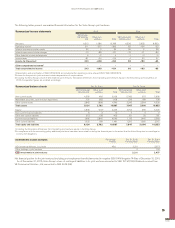
Price risks C
Exposure to price risks as a result of changed interest-rate refers to finan-
cial assets and liabilities with a longer interest-rate fixing term (fixed inter-
est).
The following table 4:1 shows the effect on earnings before taxes in
Industrial Operations net financial position, excluding pensions and similar
obligations, if interest rates were to increase by 1 percentage point, (100
basis points) assuming an average interest-rate fixed term of three months.*
The impact on equity is earnings after tax.
* The sensitivity analysis on interest rate risks is based on simplified assumptions. It is
not improbable for market interest rates to change by one percentage point (100
basis points) on an annual basis. However, in reality, these rates often rise or decline
at different points in time. The sensitivity analysis also assumes a parallel deferment of
the return curve, and that the interest rates on assets and liabilities will be equally
impacted by changes in market interest rates. Accordingly, the impact of real interest -
rate changes may differ from the analysis presented in table 4:1.
Read more in Note 20 Provisions for post-employment benefits regarding
sensitivity analysis on the defined benefit obligations when changes in the applied
assumptions for discount rate and inflations are made.
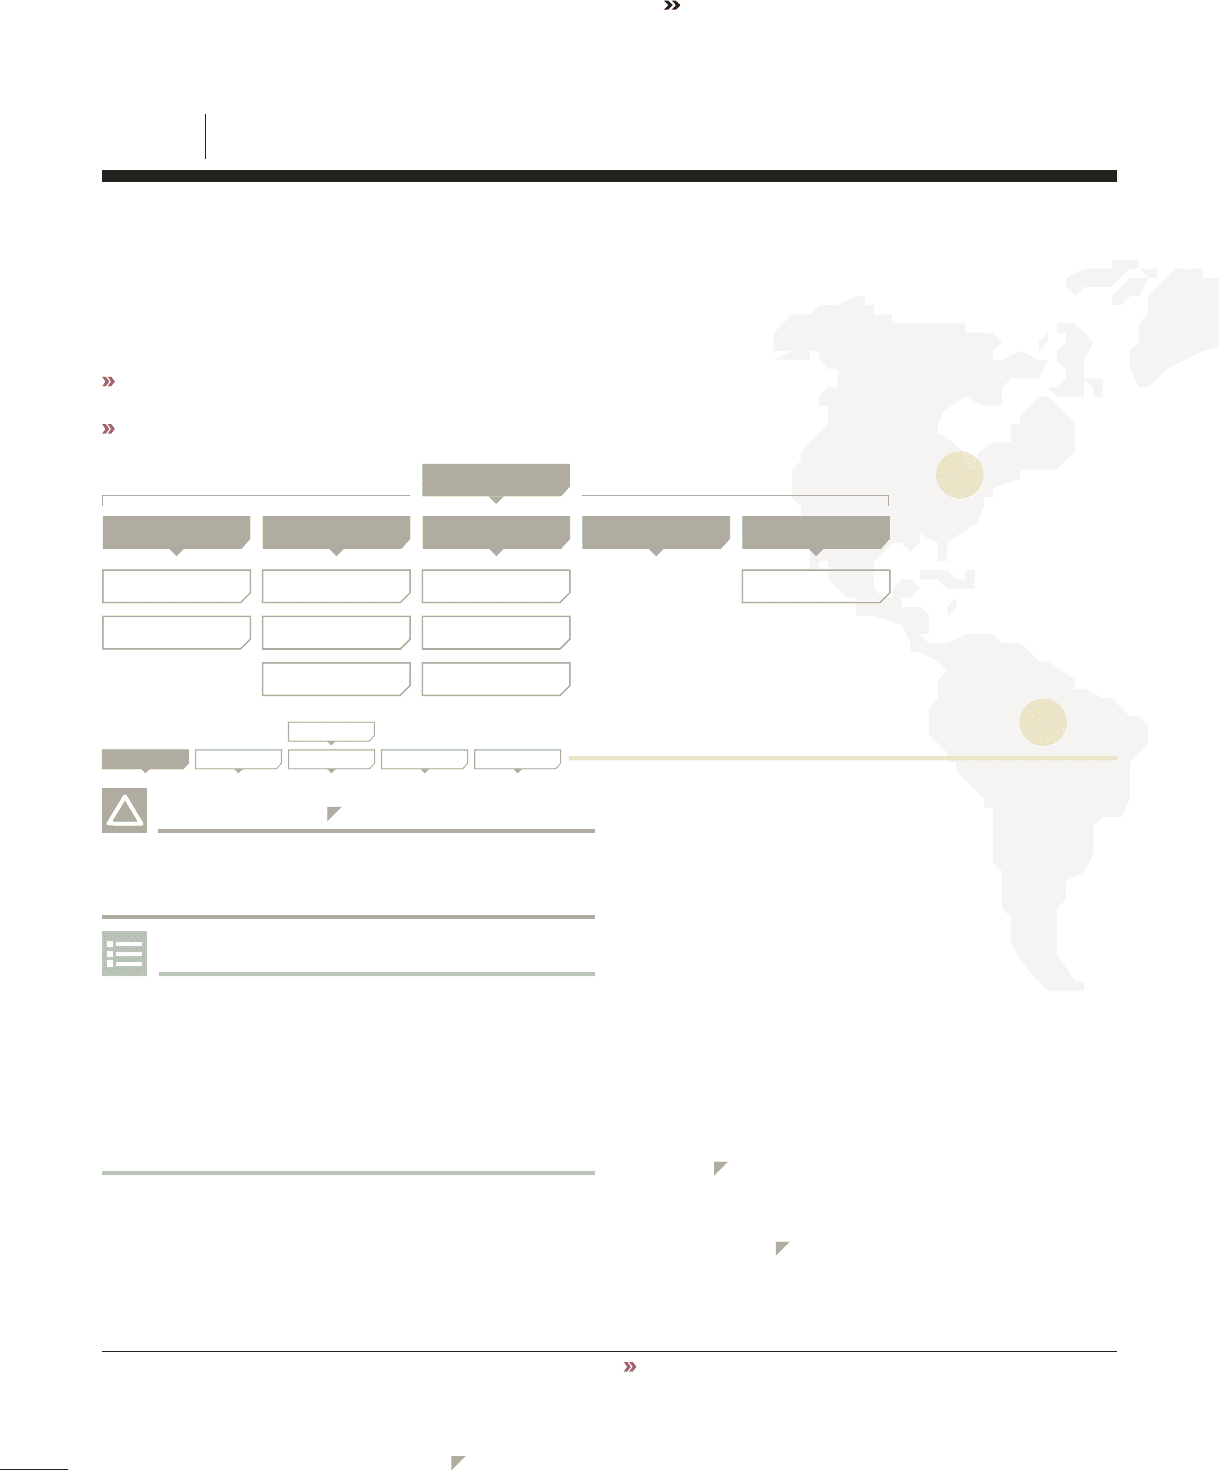
INTEREST-RATE RISKS CURRENCY RISKS CREDIT RISKS
FINANCIAL RISKS
OTHER PRICE RISKSLIQUIDITY RISKS
NOTE 4 GOALS AND POLICIES IN FINANCIAL RISK MANAGEMENT
CASH-FLOW RISKS
PRICE RISKS FINANCIAL CURRENCY
EXPOSURE
CURRENCY EXPOSURE
OF EQUITY
COMMERCIAL CURRENCY
EXPOSURE COMMERCIAL CREDIT RISK COMMODITY RISK
FINANCIAL CREDIT RISK
FINANCIAL
COUNTERPARTY RISK
INTEREST-RATE RISKS CURRENCY RISKS CREDIT RISKS
FINANCIAL RISKS
OTHER PRICE RISKSLIQUIDITY RISKS
USD
8.7
GROUP PERFORMANCE 2015 NOTES
116