Volvo 2015 Annual Report Download - page 149
Download and view the complete annual report
Please find page 149 of the 2015 Volvo annual report below. You can navigate through the pages in the report by either clicking on the pages listed below, or by using the keyword search tool below to find specific information within the annual report.-
 1
1 -
2
-
3
-
4
-
5
-
6
-
7
-
8
-
9
-
10
-
11
-
12
-
13
-
14
-
15
-
16
-
17
-
18
-
19
-
20
-
21
-
22
-
23
-
24
-
25
-
26
-
27
-
28
-
29
-
30
-
31
-
32
-
33
-
34
-
35
-
36
-
37
-
38
-
39
-
40
-
41
-
42
-
43
-
44
-
45
-
46
-
47
-
48
-
49
-
50
-
51
-
52
-
53
-
54
-
55
-
56
-
57
-
58
-
59
-
60
-
61
-
62
-
63
-
64
-
65
-
66
-
67
-
68
-
69
-
70
-
71
-
72
-
73
-
74
-
75
-
76
-
77
-
78
-
79
-
80
-
81
-
82
-
83
-
84
-
85
-
86
-
87
-
88
-
89
-
90
-
91
-
92
-
93
-
94
-
95
-
96
-
97
-
98
-
99
-
100
-
101
-
102
-
103
-
104
-
105
-
106
-
107
-
108
-
109
-
110
-
111
-
112
-
113
-
114
-
115
-
116
-
117
-
118
-
119
-
120
-
121
-
122
-
123
-
124
-
125
-
126
-
127
-
128
-
129
-
130
-
131
-
132
-
133
-
134
-
135
-
136
-
137
-
138
-
 139
139 -
 140
140 -
 141
141 -
 142
142 -
 143
143 -
 144
144 -
 145
145 -
 146
146 -
 147
147 -
 148
148 -
 149
149 -
 150
150 -
 151
151 -
 152
152 -
 153
153 -
 154
154 -
 155
155 -
 156
156 -
 157
157 -
 158
158 -
 159
159 -
160
-
161
-
162
-
163
-
164
-
165
-
166
-
167
-
168
-
169
-
170
-
171
-
172
-
173
-
174
-
175
-
176
-
177
-
178
-
179
-
180
-
181
-
182
-
183
-
184
-
185
-
186
-
187
-
188
-
189
-
190
-
191
-
192
-
193
-
194
-
195
-
196
-
197
-
198
-
199
-
200
-
201
-
202
-
203
-
204
 |
 |

GROUP PERFORMANCE 2015 NOTES
147
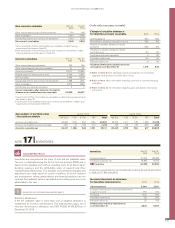
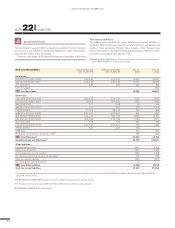
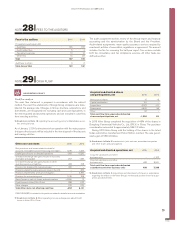
M a t u r i t y
Year Bond loans and
other loans
Not utilized
non-current credit
facilities1
2017 35,608 6,140
2018 9,171 10,973
2019 12,392 –
2020 1,643 21,032
2021 96 –
2022 or later 16,365 –
Total175,275 38,145
1 Current not utilized credit facilities amounted to SEK 1,576 M (500).
Read more in Note 15 table 15:2 Maturities of non-current receivables in the
Customer Finance operations.
AB Volvo issued a hybrid bond in 2014, amounting to EUR 1.5 bn with a
maturity of 61,6 years, in order to further strengthen the Volvo Group’s
balance sheet and prolong the maturity structure of the debt portfolio.
The predominant part of non-current loans that mature in 2017 is an
effect of the Volvo Group’s normal business cycle, with shorter duration in
the Customer Finance portfolio compared to Industrial Operations.
Granted but not unutilized credit facilities consists of stand-by facilities
for loans. A fee is charged for granted credit facilities, this is recognized in
profit or loss within other financial income and expenses.
Read more in Note 9 Other financial income and expenses.
Current liabilities
Loans Dec 31,
2015 Dec 31,
2014
Bank loans 14,495 13,705
Other loans 42,836 26,249
B/S Loans1, 2 57,331 39,953
1 Of which loans raised to finance the Customer Finance credit portfolio
amounted to SEK 48,786 M (29,672) and outstanding derivatives, at fair value,
amounted to SEK 811 M (455).
2 Current loans amounting to SEK 3,299 M (2,862) were secured by assets
pledged.
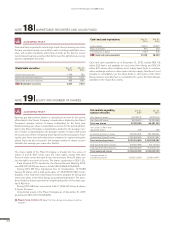
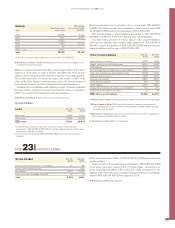
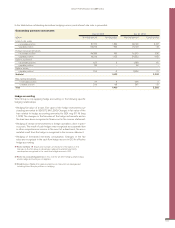
Assets pledged Dec 31,
2015 Dec 31,
2014
Property, plant and equipment – mortgages 65 88
Assets under operating leases – 209
Receivables 9,323 7,343
Cash, loans andmarketable securities 40 40
Total 9,428 7,680
Non-current and current loans of SEK 9,225 M (7,340) were secured by
assets pledged.
Under the terms of asset-backed securitizations, SEK 9,064 M (7,088)
of securities have been issued tied to US-based loans, secured by cus-
tomer financing-receivables, SEK 9,323 M (7,343), recognized on the
balance-sheet with trucks and construction equipment assets as collaterals,
whereof SEK 6,819 M (4,410) were signed in 2015.
Read more in Note 22 Liabilities.
NOTE 23 ASSETS PLEDGED
Bank loans include current maturities of non-current loans SEK 6,066 M
(6,695). Other loans include current maturities of non-current loans, SEK
32,753 M (22,458), and commercial papers, SEK 5,845 M (0).
Non-interest-bearing current liabilities amounted to SEK 98,529 M
(96,440), or 63% (71) of the Volvo Group’s total current liabilities
The table below presents the Volvo Group’s other current liabilities.
Other current liabilities also includes trade payables of SEK 55,648 M
(56,647), current tax liabilities of SEK 1,322 M (2,693) and non-interest-
bearing liabilities held for sale of SEK 573 M (130).
Other current liabilities Dec 31,
2015 Dec 31,
2014
Advances from customers 4,026 4,784
Wages, salaries and withholding taxes 8,551 9,088
VAT liabilities 2,401 1,875
Accrued expenses for dealer bonuses and rebates13,696 –
Other accrued expenses and prepaid income 12,728 11,029
Deferred leasing income 1,992 2,022
Residual value liability 2,825 2,950
Other financial liabilities 295 192
Other liabilities 4,287 4,682
Outstanding interest and currency risk derivatives 2 134 331
Outstanding raw material derivatives 50 18
B/S Other current liabilities 40,986 36,970
1 Read more in Note 21 Other provisions, section Provision for finished products
2 Read more in Note 30 Financial Instruments, regarding current part of
Outstanding interest and currency risk derivatives included in table carrying
amounts and fair value.
Read more in Note 3 Acquisitions and divestments of shares in subsidiaries,
table Assets and liabilities held for sale.
Read more in Note 23 Assets pledged.