Volvo 2015 Annual Report Download - page 161
Download and view the complete annual report
Please find page 161 of the 2015 Volvo annual report below. You can navigate through the pages in the report by either clicking on the pages listed below, or by using the keyword search tool below to find specific information within the annual report.-
 1
1 -
2
-
3
-
4
-
5
-
6
-
7
-
8
-
9
-
10
-
11
-
12
-
13
-
14
-
15
-
16
-
17
-
18
-
19
-
20
-
21
-
22
-
23
-
24
-
25
-
26
-
27
-
28
-
29
-
30
-
31
-
32
-
33
-
34
-
35
-
36
-
37
-
38
-
39
-
40
-
41
-
42
-
43
-
44
-
45
-
46
-
47
-
48
-
49
-
50
-
51
-
52
-
53
-
54
-
55
-
56
-
57
-
58
-
59
-
60
-
61
-
62
-
63
-
64
-
65
-
66
-
67
-
68
-
69
-
70
-
71
-
72
-
73
-
74
-
75
-
76
-
77
-
78
-
79
-
80
-
81
-
82
-
83
-
84
-
85
-
86
-
87
-
88
-
89
-
90
-
91
-
92
-
93
-
94
-
95
-
96
-
97
-
98
-
99
-
100
-
101
-
102
-
103
-
104
-
105
-
106
-
107
-
108
-
109
-
110
-
111
-
112
-
113
-
114
-
115
-
116
-
117
-
118
-
119
-
120
-
121
-
122
-
123
-
124
-
125
-
126
-
127
-
128
-
129
-
130
-
131
-
132
-
133
-
134
-
135
-
136
-
137
-
138
-
139
-
140
-
141
-
142
-
143
-
144
-
145
-
146
-
147
-
148
-
149
-
150
-
 151
151 -
 152
152 -
 153
153 -
 154
154 -
 155
155 -
 156
156 -
 157
157 -
 158
158 -
 159
159 -
 160
160 -
 161
161 -
 162
162 -
 163
163 -
 164
164 -
 165
165 -
 166
166 -
 167
167 -
 168
168 -
 169
169 -
 170
170 -
 171
171 -
172
-
173
-
174
-
175
-
176
-
177
-
178
-
179
-
180
-
181
-
182
-
183
-
184
-
185
-
186
-
187
-
188
-
189
-
190
-
191
-
192
-
193
-
194
-
195
-
196
-
197
-
198
-
199
-
200
-
201
-
202
-
203
-
204
 |
 |
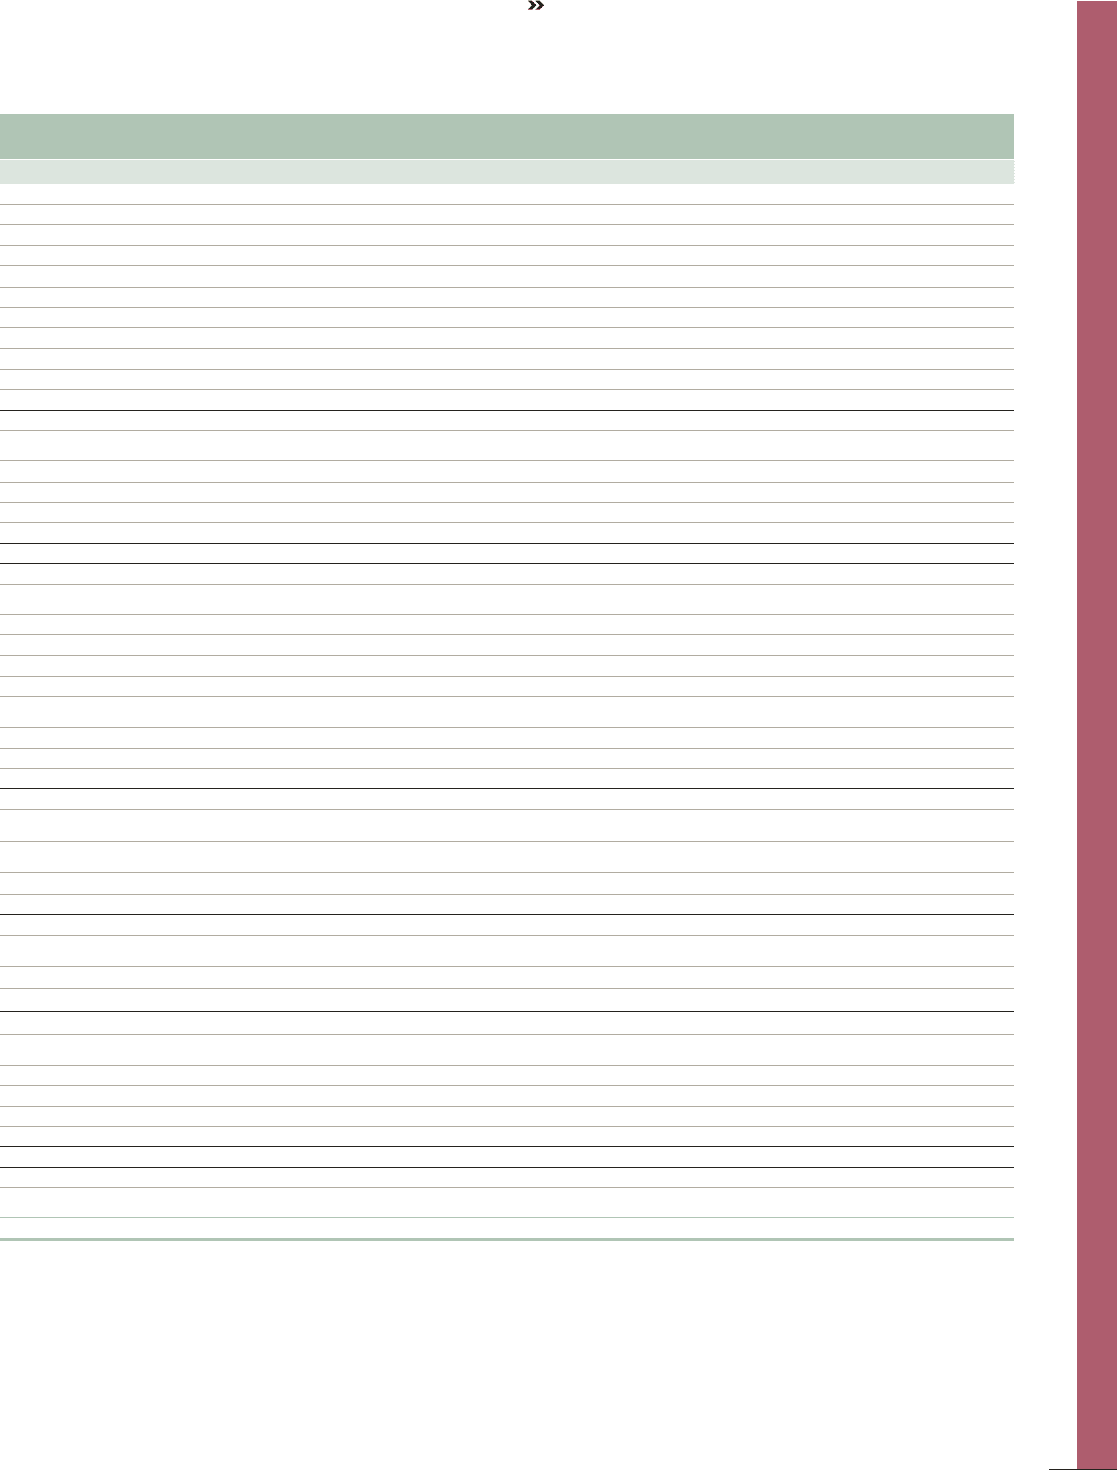
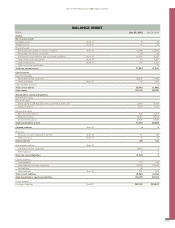
BALANCE SHEET
SEK M Dec 31, 2015 Dec 31, 2014
Assets
Non-current assets
Intangible assets Note 12 823
Tangible assets Note 12 41 54
Financial assets
Shares and participations in Group companies Note 13 60,766 61,283
Receivables from Group companies 54 59
Investments in joint ventures and associated companies Note 13 10,397 3,322
Other shares and participations Note 13 13 4,241
Deferred tax assets Note 11 157 2,191
Other non-current receivables –27
Total non-current assets 71,436 71,200
Current assets
Current receivables
Receivables Group companies 28,627 11,682
Otherreceivables Note 14 116 300
Cash and bank accounts –0
Total current assets 28,743 11,982
Total assets 100,179 83,182
Shareholders’ equity and liabilities
Shareholders’ equity
Restricted equity
Share capital (2,128,420,220 shares, quota value SEK 1.20) 2,554 2,554
Statutory reserve 7,337 7,337
Unrestricted equity
Non-restricted reserves 302 4,252
Retained earnings 18,074 17,453
Income for the period 12,739 6,690
Total shareholders’ equity 41,006 38,286
Untaxed reserves Note 15 44
Provisions
Provisions for post-employment benefits Note 16 117 122
Other provisions Note 17 11 20
Total provisions 128 142
Non-current liabilities Note 18
Liabilities to Group companies 13,973 7
Other liabilities 30
Total non-current liabilities 13,976 7
Current liabilities
Trade payables 170 166
Other liabilities to Group companies 44,470 44,269
Tax liabilities 44 –
Other liabilities Note 19 381 308
Total current liabilities 45,065 44,743
Total shareholders’ equity and liabilities 100,179 83,182
Assets pledged ––
Contingent liabilities Note 20 282,175 279,807
159
GROUP PERFORMANCE 2015 PARENT COMPANY