Volvo 2015 Annual Report Download - page 162
Download and view the complete annual report
Please find page 162 of the 2015 Volvo annual report below. You can navigate through the pages in the report by either clicking on the pages listed below, or by using the keyword search tool below to find specific information within the annual report.-
 1
1 -
2
-
3
-
4
-
5
-
6
-
7
-
8
-
9
-
10
-
11
-
12
-
13
-
14
-
15
-
16
-
17
-
18
-
19
-
20
-
21
-
22
-
23
-
24
-
25
-
26
-
27
-
28
-
29
-
30
-
31
-
32
-
33
-
34
-
35
-
36
-
37
-
38
-
39
-
40
-
41
-
42
-
43
-
44
-
45
-
46
-
47
-
48
-
49
-
50
-
51
-
52
-
53
-
54
-
55
-
56
-
57
-
58
-
59
-
60
-
61
-
62
-
63
-
64
-
65
-
66
-
67
-
68
-
69
-
70
-
71
-
72
-
73
-
74
-
75
-
76
-
77
-
78
-
79
-
80
-
81
-
82
-
83
-
84
-
85
-
86
-
87
-
88
-
89
-
90
-
91
-
92
-
93
-
94
-
95
-
96
-
97
-
98
-
99
-
100
-
101
-
102
-
103
-
104
-
105
-
106
-
107
-
108
-
109
-
110
-
111
-
112
-
113
-
114
-
115
-
116
-
117
-
118
-
119
-
120
-
121
-
122
-
123
-
124
-
125
-
126
-
127
-
128
-
129
-
130
-
131
-
132
-
133
-
134
-
135
-
136
-
137
-
138
-
139
-
140
-
141
-
142
-
143
-
144
-
145
-
146
-
147
-
148
-
149
-
150
-
151
-
 152
152 -
 153
153 -
 154
154 -
 155
155 -
 156
156 -
 157
157 -
 158
158 -
 159
159 -
 160
160 -
 161
161 -
 162
162 -
 163
163 -
 164
164 -
 165
165 -
 166
166 -
 167
167 -
 168
168 -
 169
169 -
 170
170 -
 171
171 -
 172
172 -
173
-
174
-
175
-
176
-
177
-
178
-
179
-
180
-
181
-
182
-
183
-
184
-
185
-
186
-
187
-
188
-
189
-
190
-
191
-
192
-
193
-
194
-
195
-
196
-
197
-
198
-
199
-
200
-
201
-
202
-
203
-
204
 |
 |

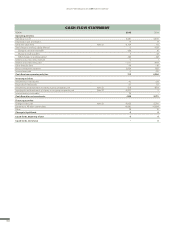
CASH FLOW STATEMENT
SEK M 2015 2014
Operating activities
Operating income 3,481 4,530
Depreciation and amortization 17 17
Other non-cash items Note 21 –5,104 113
Total change in working capital whereof 3–159
Change in accounts receivable –166 16
Change in trade payables 5–43
Other changes in working capital 164 –132
Interest and similar items received 01
Interest and similar items paid –1,171 –944
Other financial items –18 –16
Group contributions received 3,504 832
Income taxes paid 0–20
Cash-flow from operating activities 712 4,354
Investing activities
Investments in fixed assets –10 –29
Disposals of fixed assets 21 51
Investments and divestments of shares in group companies, net Note 21 519 –654
Investments and divestments of shares in non-group companies, net Note 21 –2,207 –1
Interest-bearing receivables 26 –
Cash-flow after net investments –939 3,721
Financing activities
Change in loans, net Note 21 6,953 2,291
Dividends to AB Volvo shareholders –6,090 –6,084
Other 76 72
Change in liquid funds 00
Liquid funds, beginning of year 00
Liquid funds, end of year –0
160
GROUP PERFORMANCE 2015 PARENT COMPANY