Volvo 2015 Annual Report Download - page 201
Download and view the complete annual report
Please find page 201 of the 2015 Volvo annual report below. You can navigate through the pages in the report by either clicking on the pages listed below, or by using the keyword search tool below to find specific information within the annual report.-
 1
1 -
2
-
3
-
4
-
5
-
6
-
7
-
8
-
9
-
10
-
11
-
12
-
13
-
14
-
15
-
16
-
17
-
18
-
19
-
20
-
21
-
22
-
23
-
24
-
25
-
26
-
27
-
28
-
29
-
30
-
31
-
32
-
33
-
34
-
35
-
36
-
37
-
38
-
39
-
40
-
41
-
42
-
43
-
44
-
45
-
46
-
47
-
48
-
49
-
50
-
51
-
52
-
53
-
54
-
55
-
56
-
57
-
58
-
59
-
60
-
61
-
62
-
63
-
64
-
65
-
66
-
67
-
68
-
69
-
70
-
71
-
72
-
73
-
74
-
75
-
76
-
77
-
78
-
79
-
80
-
81
-
82
-
83
-
84
-
85
-
86
-
87
-
88
-
89
-
90
-
91
-
92
-
93
-
94
-
95
-
96
-
97
-
98
-
99
-
100
-
101
-
102
-
103
-
104
-
105
-
106
-
107
-
108
-
109
-
110
-
111
-
112
-
113
-
114
-
115
-
116
-
117
-
118
-
119
-
120
-
121
-
122
-
123
-
124
-
125
-
126
-
127
-
128
-
129
-
130
-
131
-
132
-
133
-
134
-
135
-
136
-
137
-
138
-
139
-
140
-
141
-
142
-
143
-
144
-
145
-
146
-
147
-
148
-
149
-
150
-
151
-
152
-
153
-
154
-
155
-
156
-
157
-
158
-
159
-
160
-
161
-
162
-
163
-
164
-
165
-
166
-
167
-
168
-
169
-
170
-
171
-
172
-
173
-
174
-
175
-
176
-
177
-
178
-
179
-
180
-
181
-
182
-
183
-
184
-
185
-
186
-
187
-
188
-
189
-
190
-
 191
191 -
 192
192 -
 193
193 -
 194
194 -
 195
195 -
 196
196 -
 197
197 -
 198
198 -
 199
199 -
 200
200 -
 201
201 -
 202
202 -
 203
203 -
 204
204
 |
 |

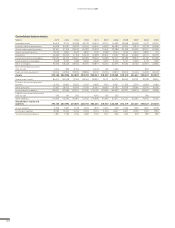
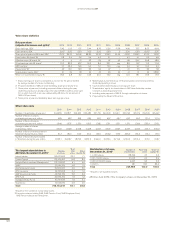
OTHER INFORMATION
2011 2010 2009 2008 20072 2006 2005
2,471; 8.1 2,315; 9.0 1,888; 9.1 2,530; 8.6 2,426; 9.6 2,612; 10.5 2,683; 11.6
255; 0.8 279; 1.1 213; 1.0 291; 1.0 242; 1.0 282; 11.4 292; 1.3
7,970; 26.2 7,519; 29.2 6,637; 31. 8 8,205; 27.8 7,067; 27.9 7,596; 30.6 7,419; 32.1
474; 1.6 719; 2.8 322; 1.5 800; 2.7 542; 2.1 606; 2.4 672; 2.9
2,554; 8.4 2,294; 8.9 1,435; 6.9 1,945; 6.6 1,979; 7.8 2,048; 8.3 1,960; 8.5
34; 0.1 33; 0.1 38; 0.2 64; 0.2 58; 0.2 69; 0.3 209; 0.9
25,943; 85.5 22,730; 88 17,558; 84 27,675; 94 27,120; 107 26,987; 108.8 23,590; 102
303.6 257.4 208.5 294.9 253.2 248.1 231.2
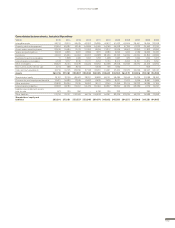
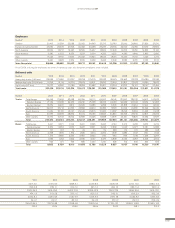
Employees
Number12015 2014 2013 2012 2011 2010 2009 2008 2007 2006 2005
Sweden 20,412 21,384 22,588 23,052 24,663 23,073 22,763 28,190 28,660 27,830 27,070
Europe, excluding Sweden 27,662 29,449 29,746 30,382 30,458 29,239 29,793 32,940 32,780 30,070 29,650
North America 15,534 15,217 16,397 16,569 15,427 12,844 12,640 14,200 15,750 14,820 15,140
South America 5,380 6,353 6,275 5,977 5,234 4,322 4,257 4,380 4,640 3,890 3,690
Asia 17,046 17,793 17, 953 20,222 19,924 18 ,535 18,416 19, 0 90 17,150 4,420 4,210
Other markets 2,430 2,626 2,574 2,515 2,456 2,396 2,339 2,580 2,720 2,160 2,100
Volvo Group total 88,464 92,822 95,533 98,717 98,162 90,409 90,208 101,380 101,700 83,190 81,860
1 As of 2009, only regular employees are shown, for previous years also temporary employees were included.
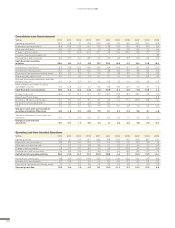
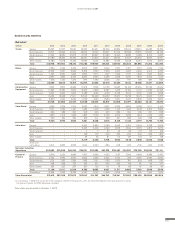
Delivered units
Number 2015 2014 2013 2012 2011 2010 2009 2008 2007 2006 2005
Heavy-duty trucks (>16 tons) 176,589 173,650 170,307 172,798 179,779 123,522 82,675 179,962 172,322 179,089 172,242
Medium-duty trucks (7–15.9 tons) 14,749 15,114 16,779 32,935 34,631 30,657 21,653 30,817 27,933 14,695 18,643
Light trucks (<7 tons) 16,137 14,360 13,188 18,284 23,982 25,811 23,354 40,372 36,101 26,147 23,494
Total trucks 207,475 203,124 200,274 224,017 238,391 179,989 127,681 251,151 236,356 219,931 214,379
Number 2015 2014 2013 2012 2011 2010 2009 2008 2007 2006 2005
Trucks Total Europe 86,448 72,458 82,088 84,355 95,113 65,503 49,145 121,847 128,070 114,417 103,622
Western Europe 71,169 57,038 64,275 63,730 75,728 56,215 43,919 95,969 100,106 97,074 91,087
Eastern Europe 15,279 15,420 17,813 20,625 19,385 9,288 5,226 25,878 27,964 17,343 12,535
North America 64,507 57,714 44,755 47,806 42,613 24,282 17,574 30,146 33,280 70,499 64,974
South America 11,069 23,741 29,137 23,443 29,274 21,483 12,587 18,092 15,264 11,646 11,248
Asia 31,979 32,399 28,692 51,514 56,165 53,833 34,800 60,725 39,916 12,817 25,706
Other markets 13,472 16,812 15,602 16,899 15,226 14,888 13,575 20,341 19,826 10,552 8,829
Total 207,475 203,124 200,274 224,017 238,391 179,989 127,681 251,151 236,356 219,931 214,379
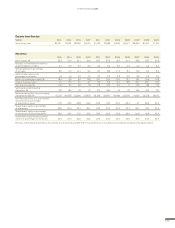
Buses Total Europe 2,431 2,221 2,146 2,491 2,695 2,395 3,164 3,313 3,748 3,570 3,723
Western Europe 2,274 2,054 2,073 2,427 2,601 2,336 2,896 3,140 3,377 3,081 3,385
Eastern Europe 157 167 73 64 94 59 268 173 371 489 338
North America 2,398 1,590 1,752 1,826 3,014 2,092 1,539 1,884 1,547 1,741 1,546
South America 1,415 2,985 2,434 2,560 2,620 1,174 690 995 1,318 1,236 2,297
Asia 1,656 1,242 1,822 2,945 3,417 3,477 3,839 3,033 2,757 3,349 2,554
Other markets 925 721 756 856 1,040 1,091 625 712 546 464 555
Total 8,825 8,759 8,910 10,678 12,786 10,229 9,857 9,937 9,916 10,360 10,675
199