Volvo 2015 Annual Report Download - page 102
Download and view the complete annual report
Please find page 102 of the 2015 Volvo annual report below. You can navigate through the pages in the report by either clicking on the pages listed below, or by using the keyword search tool below to find specific information within the annual report.-
 1
1 -
2
-
3
-
4
-
5
-
6
-
7
-
8
-
9
-
10
-
11
-
12
-
13
-
14
-
15
-
16
-
17
-
18
-
19
-
20
-
21
-
22
-
23
-
24
-
25
-
26
-
27
-
28
-
29
-
30
-
31
-
32
-
33
-
34
-
35
-
36
-
37
-
38
-
39
-
40
-
41
-
42
-
43
-
44
-
45
-
46
-
47
-
48
-
49
-
50
-
51
-
52
-
53
-
54
-
55
-
56
-
57
-
58
-
59
-
60
-
61
-
62
-
63
-
64
-
65
-
66
-
67
-
68
-
69
-
70
-
71
-
72
-
73
-
74
-
75
-
76
-
77
-
78
-
79
-
80
-
81
-
82
-
83
-
84
-
85
-
86
-
87
-
88
-
89
-
90
-
91
-
 92
92 -
 93
93 -
 94
94 -
 95
95 -
 96
96 -
 97
97 -
 98
98 -
 99
99 -
 100
100 -
 101
101 -
 102
102 -
 103
103 -
 104
104 -
 105
105 -
 106
106 -
 107
107 -
 108
108 -
 109
109 -
 110
110 -
 111
111 -
 112
112 -
113
-
114
-
115
-
116
-
117
-
118
-
119
-
120
-
121
-
122
-
123
-
124
-
125
-
126
-
127
-
128
-
129
-
130
-
131
-
132
-
133
-
134
-
135
-
136
-
137
-
138
-
139
-
140
-
141
-
142
-
143
-
144
-
145
-
146
-
147
-
148
-
149
-
150
-
151
-
152
-
153
-
154
-
155
-
156
-
157
-
158
-
159
-
160
-
161
-
162
-
163
-
164
-
165
-
166
-
167
-
168
-
169
-
170
-
171
-
172
-
173
-
174
-
175
-
176
-
177
-
178
-
179
-
180
-
181
-
182
-
183
-
184
-
185
-
186
-
187
-
188
-
189
-
190
-
191
-
192
-
193
-
194
-
195
-
196
-
197
-
198
-
199
-
200
-
201
-
202
-
203
-
204
 |
 |
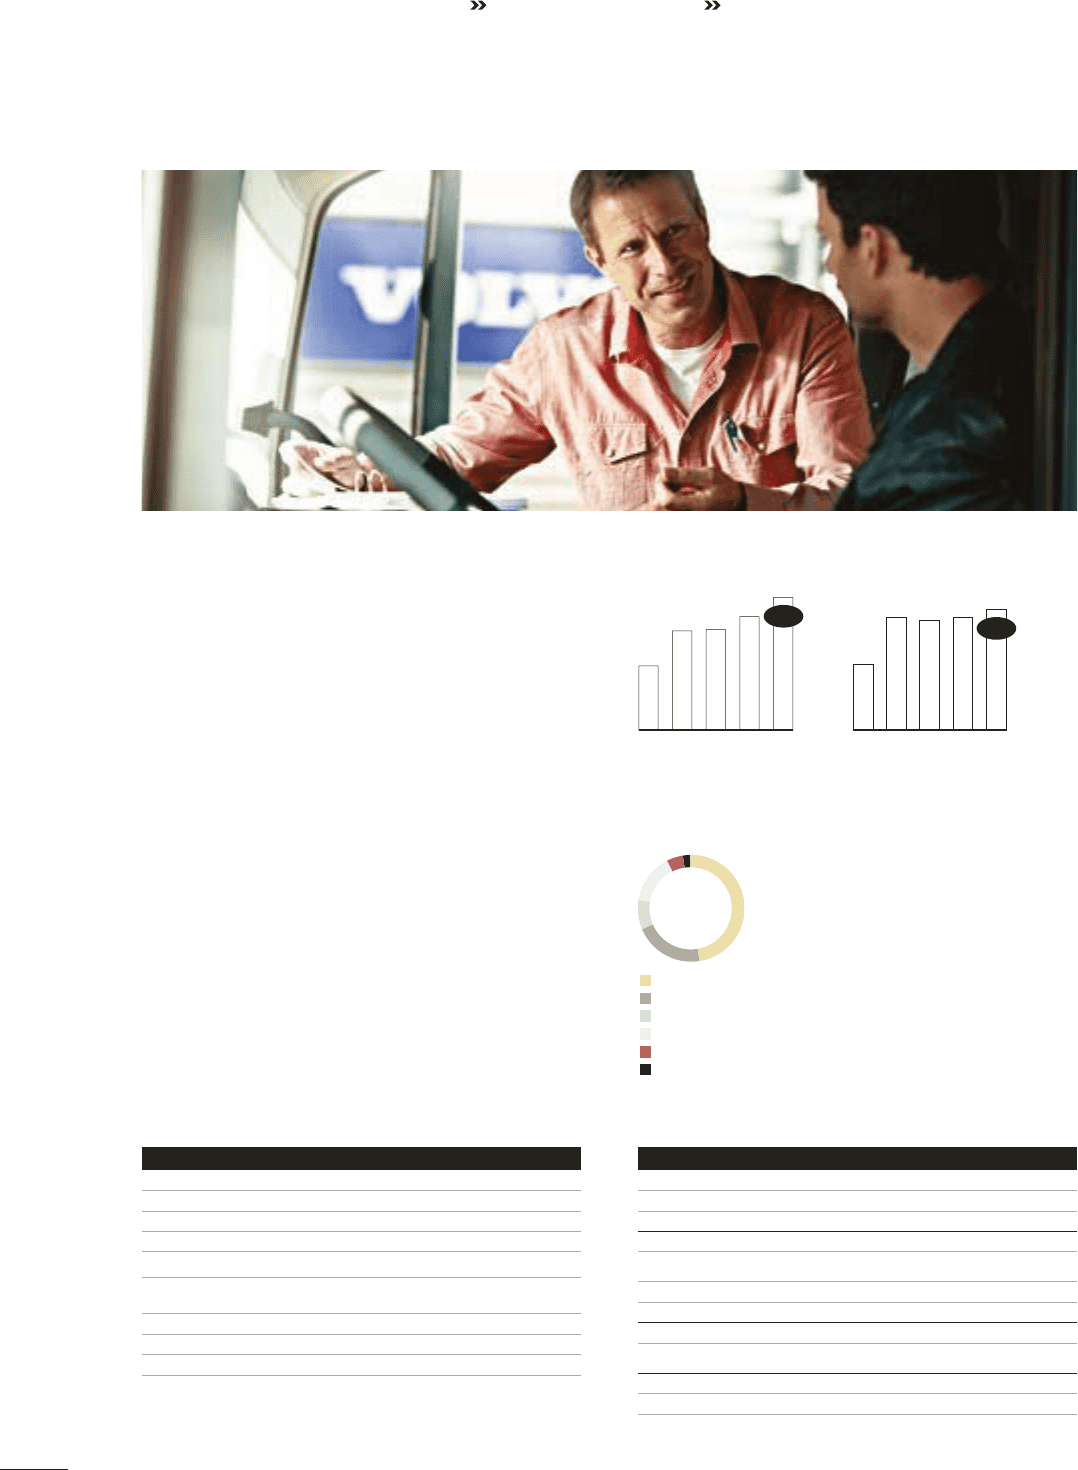
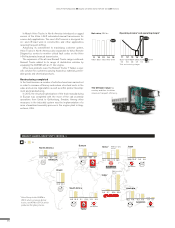
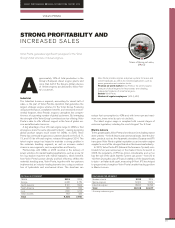
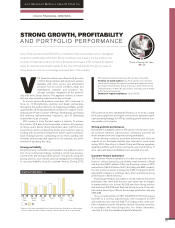
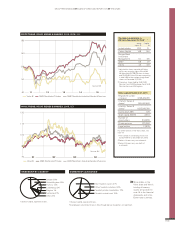
Operating income excluding restructuring charges amounted to
SEK 2,006 M compared to SEK 1,717 M in the previous year and
the return on shareholders’ equity was 13.4% (12.5). The equity
ratio at the end of the year was 8.0% (8.0). Improvements in gross
income and lower credit provisions along with good cost control
are the drivers of the overall increase in profitability.
During the year, credit provision expenses amounted to SEK
817 M (858) while write-offs of SEK 491 M (715) were recorded.
The write-off ratio for 2015 was 0.39% (0.66). At the end of
December 31, 2015, credit reserves were 1.41% (1.33) of the
credit portfolio.
Operating income*, SEK M
14
1,717
15
2,006
13
1,522
12
1,496
11
969
2,006
*Excl. restructuring charges
Return on shareholders’ equity, %
15
13.4
14
12.5
13
12.1
12
12.5
11
7.3
13.4
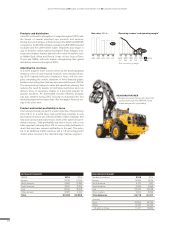
Distribution of credit portfolio
Volvo Trucks, 48%
Volvo CE, 21%
Renault Trucks, 9%
Mack Trucks, 15%
Buses, 5%
UD Trucks, 2%
KEY RATIOS, CUSTOMER FINANCE1
2015 2014
Number of financed units 49,038 54,819
New financing volume, SEK billion 54,8 54,7
Credit portfolio net, SEK billion 123 117
Credit provisions expenses SEK M 817 858
Operating income, excl. restructuring
charges SEK M 2,006 1,717
Credit reserves, % of credit portfolio 1.41 1.33
Return on shareholders’ equity, % 13.4 12.5
Total penetration rate, % 25 28
INCOME STATEMENT CUSTOMER FINANCE, SEK M
2015 2014
Finance and lease income 11,199 10,111
Finance and lease expenses –6,607 –5,923
Gross income 4,591 4,188
Selling and administrative expenses –1,878 –1,711
Credit provision expenses –817 –858
Other operating income and expenses 109 98
Operating income 2,006 1,717*
Income taxes –633 –568
Income for the period 1,373 1,149
Return on Equity, % 13.4 12.5
* Excl. restructuring charges.
GROUP PERFORMANCE BOARD OF DIRECTORS’ REPORT 2015 VOLVO FINANCIAL SERVICES
100