Volvo 2015 Annual Report Download - page 166
Download and view the complete annual report
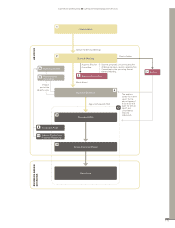
Please find page 166 of the 2015 Volvo annual report below. You can navigate through the pages in the report by either clicking on the pages listed below, or by using the keyword search tool below to find specific information within the annual report.-
 1
1 -
2
-
3
-
4
-
5
-
6
-
7
-
8
-
9
-
10
-
11
-
12
-
13
-
14
-
15
-
16
-
17
-
18
-
19
-
20
-
21
-
22
-
23
-
24
-
25
-
26
-
27
-
28
-
29
-
30
-
31
-
32
-
33
-
34
-
35
-
36
-
37
-
38
-
39
-
40
-
41
-
42
-
43
-
44
-
45
-
46
-
47
-
48
-
49
-
50
-
51
-
52
-
53
-
54
-
55
-
56
-
57
-
58
-
59
-
60
-
61
-
62
-
63
-
64
-
65
-
66
-
67
-
68
-
69
-
70
-
71
-
72
-
73
-
74
-
75
-
76
-
77
-
78
-
79
-
80
-
81
-
82
-
83
-
84
-
85
-
86
-
87
-
88
-
89
-
90
-
91
-
92
-
93
-
94
-
95
-
96
-
97
-
98
-
99
-
100
-
101
-
102
-
103
-
104
-
105
-
106
-
107
-
108
-
109
-
110
-
111
-
112
-
113
-
114
-
115
-
116
-
117
-
118
-
119
-
120
-
121
-
122
-
123
-
124
-
125
-
126
-
127
-
128
-
129
-
130
-
131
-
132
-
133
-
134
-
135
-
136
-
137
-
138
-
139
-
140
-
141
-
142
-
143
-
144
-
145
-
146
-
147
-
148
-
149
-
150
-
151
-
152
-
153
-
154
-
155
-
 156
156 -
 157
157 -
 158
158 -
 159
159 -
 160
160 -
 161
161 -
 162
162 -
 163
163 -
 164
164 -
 165
165 -
 166
166 -
 167
167 -
 168
168 -
 169
169 -
 170
170 -
 171
171 -
 172
172 -
 173
173 -
 174
174 -
 175
175 -
 176
176 -
177
-
178
-
179
-
180
-
181
-
182
-
183
-
184
-
185
-
186
-
187
-
188
-
189
-
190
-
191
-
192
-
193
-
194
-
195
-
196
-
197
-
198
-
199
-
200
-
201
-
202
-
203
-
204
 |
 |
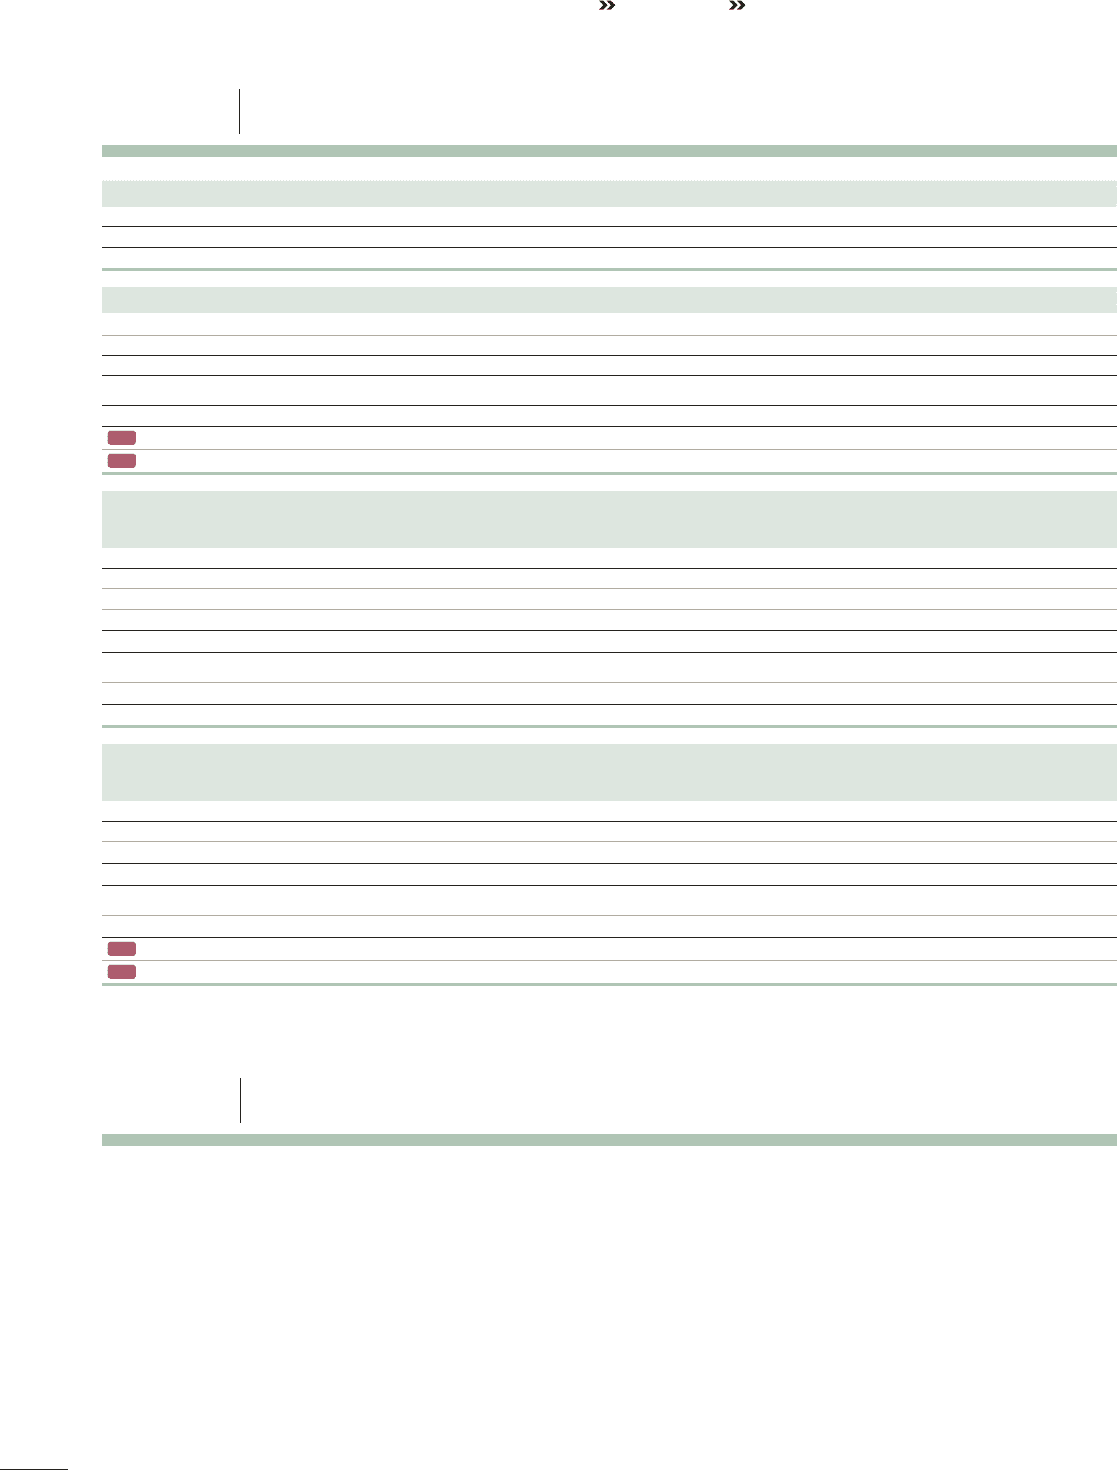
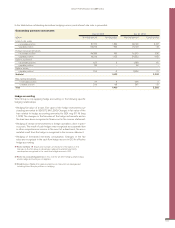
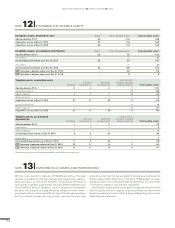
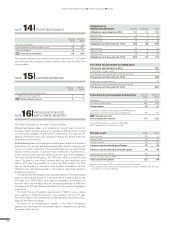
Intangible assets, acquisition costs Rights Other intangible assets Total intangible assets
Opening balance 2014 52 116 168
Acquisition cost as of Dec 31, 2014 52 116 168
Acquisition cost as of Dec 31, 2015 52 116 168
Intangible assets, accumulated amortization Rights Other intangible assets Total intangible assets
Opening balance 2014 52 78 130
Amortization – 15 15
Accumulated amortization as of Dec 31, 2014 52 93 145
Amortization –1515
Accumulated amortization as of Dec 31, 2015 52 108 160
B/S Net value in balance sheet as of Dec 31, 20141–2323
B/S Net value in balance sheet as of Dec 31, 20151–88
Tangible assets, acquisition costs
Buildings
Land and
improvements
Machinery
and equipment
Construction in
progress, including
advance payments Total tangible assets
Opening balance 2014 27 14 47 21 109
Capital Expenditures – – – 28 28
Sales/scrapping –6 –3 0 –38 –47
Reclassifications – – 0 0 0
Acquisition cost as of Dec 31, 2014 21 11 47 11 90
Capital Expenditures – – – 10 10
Sales/scrapping – – – –21 –21
Acquisition cost as of Dec 31, 2015 21 11 47 0 79
Tangible assets, accumulated
depreciation Buildings
Land and
improvements
Machinery
and equipment
Construction in
progress, including
advance payments Total tangible assets
Opening balance 2014 50 32 – 37
Depreciation 1 0 2 – 3
Sales/scrapping –3 – –1 – –4
Accumulated depreciation as Dec 31, 2014 3 0 33 – 36
Depreciation 1 0 1 – 2
Accumulated depreciation as of Dec 31, 2015 4 0 34 – 38
B/S Net value in balance sheet as of Dec 31, 2014118 11 14 11 5 4
B/S Net value in balance sheet as of Dec 31, 2015117 11 13 0 41
1 Acquisition value, less accumulated depreciation, amortization and impairment.
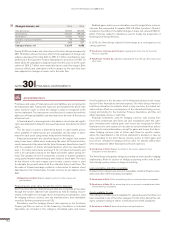
NOTE 12 INTANGIBLE AND TANGIBLE ASSETS
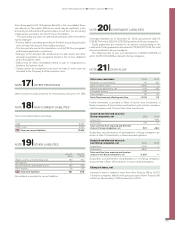
NOTE 13 INVESTMENTS IN SHARES AND PARTICIPATIONS
AB Volvo owns, directly or indirectly, 278 (294) legal entities. The legal
structure is designed to effectively manage legal requirements, adminis-
tration and taxes, as well as the operations conducted by the Group in
each country it operates. Legal entities may have different characters and
include different types of operations, such as production, development
and sales. The character of a legal entity may change over time. Further-
more legal entities could include different type of the Group’s operations
and this could also change over time. In some countries there are legal
restrictions which limit the Group’s ability to transfer assets between the
Group’s legal entities. Read more in the Note 18 Marketable securities
and liquid funds in the consolidated financial statements for a description
of restrictions related to cash and cash equivalents.
Volvo Group’s operational structure gives a better overview of how the
Volvo Group has chosen to organize its business. Read more about Volvo
Group’s operational structure in Note 6 Segment Reporting in the consol-
idated financial statements.
164
GROUP PERFORMANCE 2015 PARENT COMPANY NOTES