Volvo 2015 Annual Report Download - page 193
Download and view the complete annual report
Please find page 193 of the 2015 Volvo annual report below. You can navigate through the pages in the report by either clicking on the pages listed below, or by using the keyword search tool below to find specific information within the annual report.-
 1
1 -
2
-
3
-
4
-
5
-
6
-
7
-
8
-
9
-
10
-
11
-
12
-
13
-
14
-
15
-
16
-
17
-
18
-
19
-
20
-
21
-
22
-
23
-
24
-
25
-
26
-
27
-
28
-
29
-
30
-
31
-
32
-
33
-
34
-
35
-
36
-
37
-
38
-
39
-
40
-
41
-
42
-
43
-
44
-
45
-
46
-
47
-
48
-
49
-
50
-
51
-
52
-
53
-
54
-
55
-
56
-
57
-
58
-
59
-
60
-
61
-
62
-
63
-
64
-
65
-
66
-
67
-
68
-
69
-
70
-
71
-
72
-
73
-
74
-
75
-
76
-
77
-
78
-
79
-
80
-
81
-
82
-
83
-
84
-
85
-
86
-
87
-
88
-
89
-
90
-
91
-
92
-
93
-
94
-
95
-
96
-
97
-
98
-
99
-
100
-
101
-
102
-
103
-
104
-
105
-
106
-
107
-
108
-
109
-
110
-
111
-
112
-
113
-
114
-
115
-
116
-
117
-
118
-
119
-
120
-
121
-
122
-
123
-
124
-
125
-
126
-
127
-
128
-
129
-
130
-
131
-
132
-
133
-
134
-
135
-
136
-
137
-
138
-
139
-
140
-
141
-
142
-
143
-
144
-
145
-
146
-
147
-
148
-
149
-
150
-
151
-
152
-
153
-
154
-
155
-
156
-
157
-
158
-
159
-
160
-
161
-
162
-
163
-
164
-
165
-
166
-
167
-
168
-
169
-
170
-
171
-
172
-
173
-
174
-
175
-
176
-
177
-
178
-
179
-
180
-
181
-
182
-
 183
183 -
 184
184 -
 185
185 -
 186
186 -
 187
187 -
 188
188 -
 189
189 -
 190
190 -
 191
191 -
 192
192 -
 193
193 -
 194
194 -
 195
195 -
 196
196 -
 197
197 -
 198
198 -
 199
199 -
 200
200 -
 201
201 -
 202
202 -
 203
203 -
204
 |
 |

OTHER INFORMATION
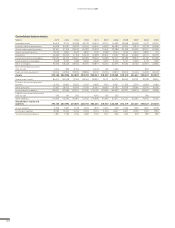
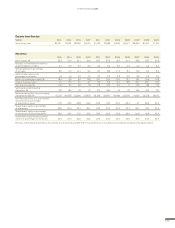
Eleven-year Summary
The reporting in the eleven-year summary is based on IFRS. As from Jan-
uary 1, 2007, the benefits from the synergies created in the business
units are transferred back to the business areas. Also, as from January 1,
2007, the responsibility for the Group’s treasury operations and real
estate has been transferred from Volvo Financial Services, which, as from
January 1, 2007, only are consolidated in accordance with the purchase
method. Comparison figures for 2006 have been recalculated.
Consolidated income statement
SEK M 2015 2014 2013 2012 2011 2010 2009 2008 2007 2006 2005
Net sales 312,515 282,948 272,622 303,647 310,367 264,749 218,361 303,667 285,405 258,835 240,559
Cost of sales –240,653 –220,012 –212,504 –235,085 –235,104 –201,797 –186,167 –237,578 –219,600 –199,054 –186,662
Gross income 71,862 62,937 60,118 68,562 75,263 62,952 32,194 66,089 65,805 59,781 53,897
Research and development
expenses –15,368 –16 ,656 –15,124 –14,794 –13,276 –12,970 –13,193 –14,348 –11,059 –8, 354 –7,557
Selling expenses –27,694 –27,448 –28,506 –28,248 –26,001 –24,149 –25,334 –27,129 –26,068 –21,213 –20,778
Administrative expenses –5,769 –5,408 –5,862 –5,669 –7,132 –5,666 –5,863 –6,940 –7,133 –6,551 –6,301
Other operating income
and expenses –4,179 –7,697 –3,554 –2,160 –1,649 –2,023 –4,798 –1,915 163 –3,466 –588
Income from investments
in joint ventures and
associated companies –143 46 96 –23 –81 –86 –14 25 430 61 –557
Income from other investments 4,609 50 –30 –47 –225 –58 –6 69 93 141 37
Operating income 23,318 5,824 7,138 17,622 26,899 18,000 –17,013 15,851 22,231 20,399 18,153
Interest income
and similar credits 257 328 381 510 608 442 390 1,171 952 666 654
Interest expenses
and similar charges –2,366 –1,994 –2,810 –2,476 –2,875 –3,142 –3,559 –1,935 –1,122 –585 –972
Other financial income
and expenses –792 931 11 –301 297 213 –392 –1,077 –504 –181 181
Income after financial items 20,418 5,089 4,721 15,355 24,929 15,514 –20,573 14,010 21,557 20,299 18,016
Income taxes –5,320 –2,854 –919 –4,097 –6,814 –4,302 5,889 –3,994 –6,529 –3,981 –4,908
Income for the period 15,099 2,235 3,802 11,258 18,115 11,212 –14,685 10,016 15,028 16,318 13,108
Attributable to:
Equity holders of the
Parent Company 15,058 2,099 3,583 11,039 17,751 10,866 –14,718 9,942 14,932 16,268 13,054
Minority interest 41 136 219 219 364 346 33 74 96 50 54
15,099 2,235 3,802 11,258 18,115 11,212 –14,685 10,016 15,028 16,318 13,108
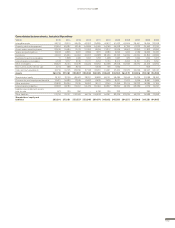
Consolidated income statement Industrial Operations
SEK M 2015 2014 2013 2012 2011 2010 2009 2008 2007 2006 2005
Net sales 303,582 275,999 265,420 296,031 303,589 257,375 208,487 294,932 276,795 249,020 231,191
Cost of sales –236,311 –217,251 –209,307 –231,216 –233,097 –197,480 –179,578 –232,247 –214,160 –192,400 –180,823
Gross income 67,271 58,748 56,113 64,815 70,492 59,895 28,909 62,685 62,635 56,620 50,368
Research and development
expenses –15, 368 –16,656 –15,124 –14,794 –13,276 –12,970 –13,193 –14,348 –11,059 –8,354 –7,557
Selling expenses –25,857 –25,778 –26,904 –26,582 –25,181 –22,649 –23,752 –25,597 –24,671 –19,999 –19,616
Administrative expenses –5,728 –5,367 –5,824 –5,639 –4,753 –5,640 –5,838 –6,921 –7,092 –6,481 –6,147
Other operating income
and expenses –3,473 –6,931 –2,710 –1,600 –1,045 –659 –2,432 –1,457 249 –3,275 –397
Income from Volvo Financial
Services ––––––––––2,033
Income/lossfrom investments
in joint ventures andassociated
companies –143 46 96 –23 –82 –86 –15 23 428 61 –568
Income from other investments 4,610 49 –31 –46 –225 –57 –13 69 93 141 37
Operating income 21,312 4,111 5,616 16,130 25,930 17,834 –16,333 14,454 20,583 18,713 18,153
191