Volvo 2015 Annual Report Download - page 196
Download and view the complete annual report
Please find page 196 of the 2015 Volvo annual report below. You can navigate through the pages in the report by either clicking on the pages listed below, or by using the keyword search tool below to find specific information within the annual report.-
 1
1 -
2
-
3
-
4
-
5
-
6
-
7
-
8
-
9
-
10
-
11
-
12
-
13
-
14
-
15
-
16
-
17
-
18
-
19
-
20
-
21
-
22
-
23
-
24
-
25
-
26
-
27
-
28
-
29
-
30
-
31
-
32
-
33
-
34
-
35
-
36
-
37
-
38
-
39
-
40
-
41
-
42
-
43
-
44
-
45
-
46
-
47
-
48
-
49
-
50
-
51
-
52
-
53
-
54
-
55
-
56
-
57
-
58
-
59
-
60
-
61
-
62
-
63
-
64
-
65
-
66
-
67
-
68
-
69
-
70
-
71
-
72
-
73
-
74
-
75
-
76
-
77
-
78
-
79
-
80
-
81
-
82
-
83
-
84
-
85
-
86
-
87
-
88
-
89
-
90
-
91
-
92
-
93
-
94
-
95
-
96
-
97
-
98
-
99
-
100
-
101
-
102
-
103
-
104
-
105
-
106
-
107
-
108
-
109
-
110
-
111
-
112
-
113
-
114
-
115
-
116
-
117
-
118
-
119
-
120
-
121
-
122
-
123
-
124
-
125
-
126
-
127
-
128
-
129
-
130
-
131
-
132
-
133
-
134
-
135
-
136
-
137
-
138
-
139
-
140
-
141
-
142
-
143
-
144
-
145
-
146
-
147
-
148
-
149
-
150
-
151
-
152
-
153
-
154
-
155
-
156
-
157
-
158
-
159
-
160
-
161
-
162
-
163
-
164
-
165
-
166
-
167
-
168
-
169
-
170
-
171
-
172
-
173
-
174
-
175
-
176
-
177
-
178
-
179
-
180
-
181
-
182
-
183
-
184
-
185
-
 186
186 -
 187
187 -
 188
188 -
 189
189 -
 190
190 -
 191
191 -
 192
192 -
 193
193 -
 194
194 -
 195
195 -
 196
196 -
 197
197 -
 198
198 -
 199
199 -
 200
200 -
 201
201 -
 202
202 -
 203
203 -
 204
204
 |
 |
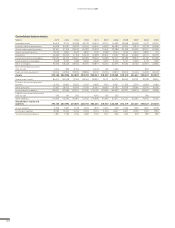
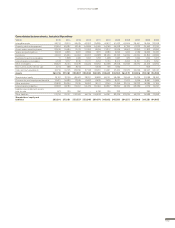
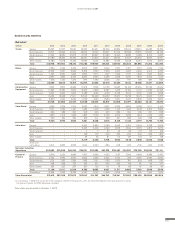
Consolidated cash-flow statements
SEK bn 2015 2014 2013 2012 2011 2010 2009 2008 2007 2006 2005
Operating income/loss 23.3 5.8 7.1 17.6 26.9 18.0 –17.0 15.9 22.2 20.4 18.2
Depreciation and amortization 16.8 15.9 17.4 14.7 13.9 13.8 15.2 13.5 12.5 12.4 9.9
Other non-cash items –0.5 6.1 2.4 1.4 1.3 1.6 4.4 –0.2 –0.5 0.7 0.4
Change in working capital –9.0 –14.1 –10.8 –21.9 –15.1 4.8 16.9 –23.3 –9.9 –7.7 –4.7
Customer financing receivables, net –––––––––––7.8
Financial items and income tax –4.6 –5.0 –5.1 –8.0 –7.3 –5.5 –4.6 –5.2 –5.9 –4.3 –2.0
Cash-flow from operating
activities 25.9 8.7 11.0 3.8 19.7 32.7 14.9 0.7 18.4 21.5 14.0
Investments in fixed assets –8. 8 –8.6 –12.2 –14.6 –12.6 –10.4 –10.5 –12.7 –10.1 –10.0 –10.3
Investments in leasing assets –10.5 –10.1 –8.2 –10.0 –7.4 –4.8 –4.2 –5.4 –4.8 –4.6 –4.5
Disposals of fixed assets and leasing assets 6.0 5.0 3.4 3.1 3.3 3.1 3.8 2.9 2.9 3.2 2.6
Shares and participations, net –2.0 0.1 0.0 –1.2 –0.1 –0.1 0.0 0.0 0.4 –5.8 0.3
Acquired and divested subsidiaries and other
business units, net 0.4 7.4 0. 9 3.4 –1.6 0.6 0.2 –1.3 –15.0 0.5 0.7
Interest-bearing receivables including
marketable securities 3.6 –4.8 0.5 3.7 2.6 6.8 –8.9 10.9 3.6 7.7 –1.3
Cash-flow after net investments 14.5 –2.3 –4.6 –11.8 3.9 27.9 –4.7 –4.9 –4.6 12.5 1.5
Changein loans, net –13.2 6.7 13.0 14.1 8.7 –25.7 12.6 18.2 28.7 –2.6 3.6
Repurchase of own shares ––––––0.0––––1.8
Dividend to AB Volvo’s shareholders –6.1 –6.1 –6.1 –6.1 –5.1 0.0 –4.1 –11.1 –20.3 –6.8 –5.1
Dividend to minority shareholder’s –0.00.0–0.20.00.0–0.1–––––
Other 0.0 –0.1 0.1 0.0 0.0 0.0 –0.1 0.0 0.0 0.0 0.0
Change in cash and cash equivalents
excluding translation differences –4.8 –1.8 2.2 –3.8 7.5 2.1 3.7 2.2 3.8 3.1 –1.8
Translation differences on cash and cash
equivalents –0.4 1.1 –0.5 –0.8 –0.1 –0.4 –0.2 1.0 0.0 –0.5 1.1
Change in cash and cash
equivalents –5.2 –0.7 1.7 –4.6 7.4 1.7 3.5 3.2 3.8 2.6 –0.7
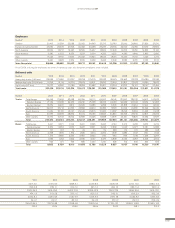
Operating cash-flow Industrial Operations
SEK bn 2015 2014 2013 2012 2011 2010 2009 2008 2007 2006 2005
Operating income 21.3 4.1 5.6 16.1 26.0 17.8 –16.3 14.5 20.6 18.7 16.1
Depreciation and amortization 12.6 12.7 14.5 12.0 11.4 11.4 12.4 11.8 10.3 9.8 7.3
Other items not affecting cash –1.1 5.3 1.5 0.8 0.6 0.1 2.3 –0.7 –0.4 0.2 0.2
Change in working capital –1.9 –3.3 –2.0 –9.2 –4.2 4.6 4.7 –10.9 –0.1 –3.1 –5.6
Financial items and income taxes –4.0 –4.5 –4.9 –7.3 –6.9 –5.1 –4.7 –5.0 –6.0 –3.7 –1.9
Cash-flow from operating activities 26.7 14.3 14.7 12.4 26.9 28.8 –1.6 9.7 24.4 21.9 16.1
Investments in fixed assets –8.8 –8.6 –12.2 –14.6 –12.6 –10.3 –10.3 –12.6 –10.1 –9.7 –9.9
Investments in leasing assets –0.3 –0.5 –1.5 –3.6 –1.4 –0.3 –0.2 –0.4 –0.2 –0.5 –0.3
Disposals of fixed assets and leasing assets 0.7 1.1 0.5 0.9 1.2 0.8 0.7 0.6 1.1 0.9 0.9
Operating cash-flow 18.3 6.4 1.5 –4.9 14.1 19.0 –11.4 –2.7 15.2 12.6 6.8
OTHER INFORMATION
194