Volvo 2015 Annual Report Download - page 139
Download and view the complete annual report
Please find page 139 of the 2015 Volvo annual report below. You can navigate through the pages in the report by either clicking on the pages listed below, or by using the keyword search tool below to find specific information within the annual report.-
 1
1 -
2
-
3
-
4
-
5
-
6
-
7
-
8
-
9
-
10
-
11
-
12
-
13
-
14
-
15
-
16
-
17
-
18
-
19
-
20
-
21
-
22
-
23
-
24
-
25
-
26
-
27
-
28
-
29
-
30
-
31
-
32
-
33
-
34
-
35
-
36
-
37
-
38
-
39
-
40
-
41
-
42
-
43
-
44
-
45
-
46
-
47
-
48
-
49
-
50
-
51
-
52
-
53
-
54
-
55
-
56
-
57
-
58
-
59
-
60
-
61
-
62
-
63
-
64
-
65
-
66
-
67
-
68
-
69
-
70
-
71
-
72
-
73
-
74
-
75
-
76
-
77
-
78
-
79
-
80
-
81
-
82
-
83
-
84
-
85
-
86
-
87
-
88
-
89
-
90
-
91
-
92
-
93
-
94
-
95
-
96
-
97
-
98
-
99
-
100
-
101
-
102
-
103
-
104
-
105
-
106
-
107
-
108
-
109
-
110
-
111
-
112
-
113
-
114
-
115
-
116
-
117
-
118
-
119
-
120
-
121
-
122
-
123
-
124
-
125
-
126
-
127
-
128
-
 129
129 -
 130
130 -
 131
131 -
 132
132 -
 133
133 -
 134
134 -
 135
135 -
 136
136 -
 137
137 -
 138
138 -
 139
139 -
 140
140 -
 141
141 -
 142
142 -
 143
143 -
 144
144 -
 145
145 -
 146
146 -
 147
147 -
 148
148 -
 149
149 -
150
-
151
-
152
-
153
-
154
-
155
-
156
-
157
-
158
-
159
-
160
-
161
-
162
-
163
-
164
-
165
-
166
-
167
-
168
-
169
-
170
-
171
-
172
-
173
-
174
-
175
-
176
-
177
-
178
-
179
-
180
-
181
-
182
-
183
-
184
-
185
-
186
-
187
-
188
-
189
-
190
-
191
-
192
-
193
-
194
-
195
-
196
-
197
-
198
-
199
-
200
-
201
-
202
-
203
-
204
 |
 |
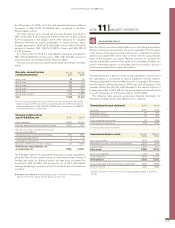
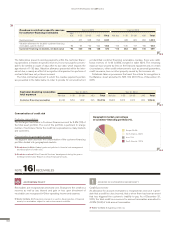
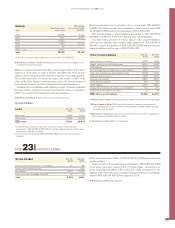
Credit risks in accounts receivable
Change of valuation allowance
for doubtful accounts receivable 2015 2014
Opening balance 834 606
New valuation allowance charged to income 695 415
Reversal of valuation allowance charged
to income –250 –123
Utilization of valuation allowance related
to actual losses –34 –65
Acquired and divested operations 0 –23
Translation differences –34 60
Reclassifications, etc 8 –36
Valuation allowance for doubtful accounts
receivables as of December 31 1,219 834
Refer to Note 8 Other operating income and expenses, for information
regarding credit provisions for Volvo CE in China.
Refer to Note 15 for information regarding credit risk in customer financing
receivables.
Refer to Note 30 for information regarding goals and policies for financial
instruments.
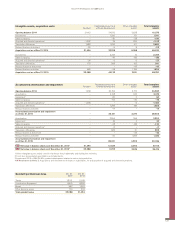
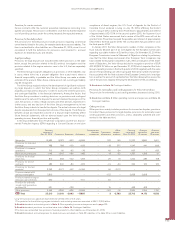
Age analysis of portfolio value
– Accounts receivable
Dec31, 2015 Dec 31, 2014
Not Due 1–30 31–90 >90 Total Not Due 1–30 31–90 >90 Total
Accounts receivable gross 26,798 1,102 656 1,765 30,320 28,572 1,311 578 1,268 31,728
Provision for doubtful accounts receivable –381 –16 –108 –714 –1,219 –123 –35 –25 –650 –834
Accounts receivable net 26,417 1,086 548 1,051 29,101 28,449 1,275 553 617 30,895
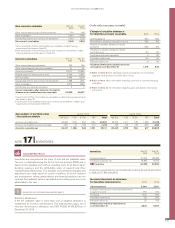
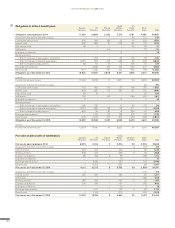
Non-current receivables Dec 31,
2015 Dec 31,
2014
Other interest-bearing loans to external parties
1739 602
Other receivables 2,644 2,826
Outstanding interest and currency risk derivatives
21,034 1,526
Non-current receivables 4,418 4,954
1 Non-current part of Other interest bearing receivables in table Carrying
amounts and fair values in Note 30.
2 Non-current part of Outstanding interest and currency risk derivatives in table
Carrying amounts and fair values in Note 30.
Current receivables Dec31,
2015 Dec 31,
2014
Other interest-bearing receivables
1743 374
Other interest-bearing financial receivables 61 61
Accounts receivable 29,101 30,895
Prepaid expenses and accrued income 2,906 2,854
VAT receivables 3,789 3,676
Outstanding interest and currency risk derivatives
21,588 1,351
Other receivables 6,615 7,463
Outstanding raw materials derivatives 5 3
Current receivables, after deduction of valuation
allowances for doubtful accounts receivable 44,809 46,677
1 Current part of Other interest bearing receivables in table Carrying amounts and
fair values in Note 30.
2 Current part of Outstanding interest and currency risk derivatives in table Carry-
ing amounts and fair values in Note 30.
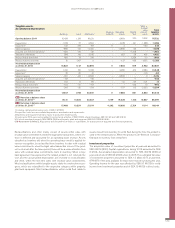
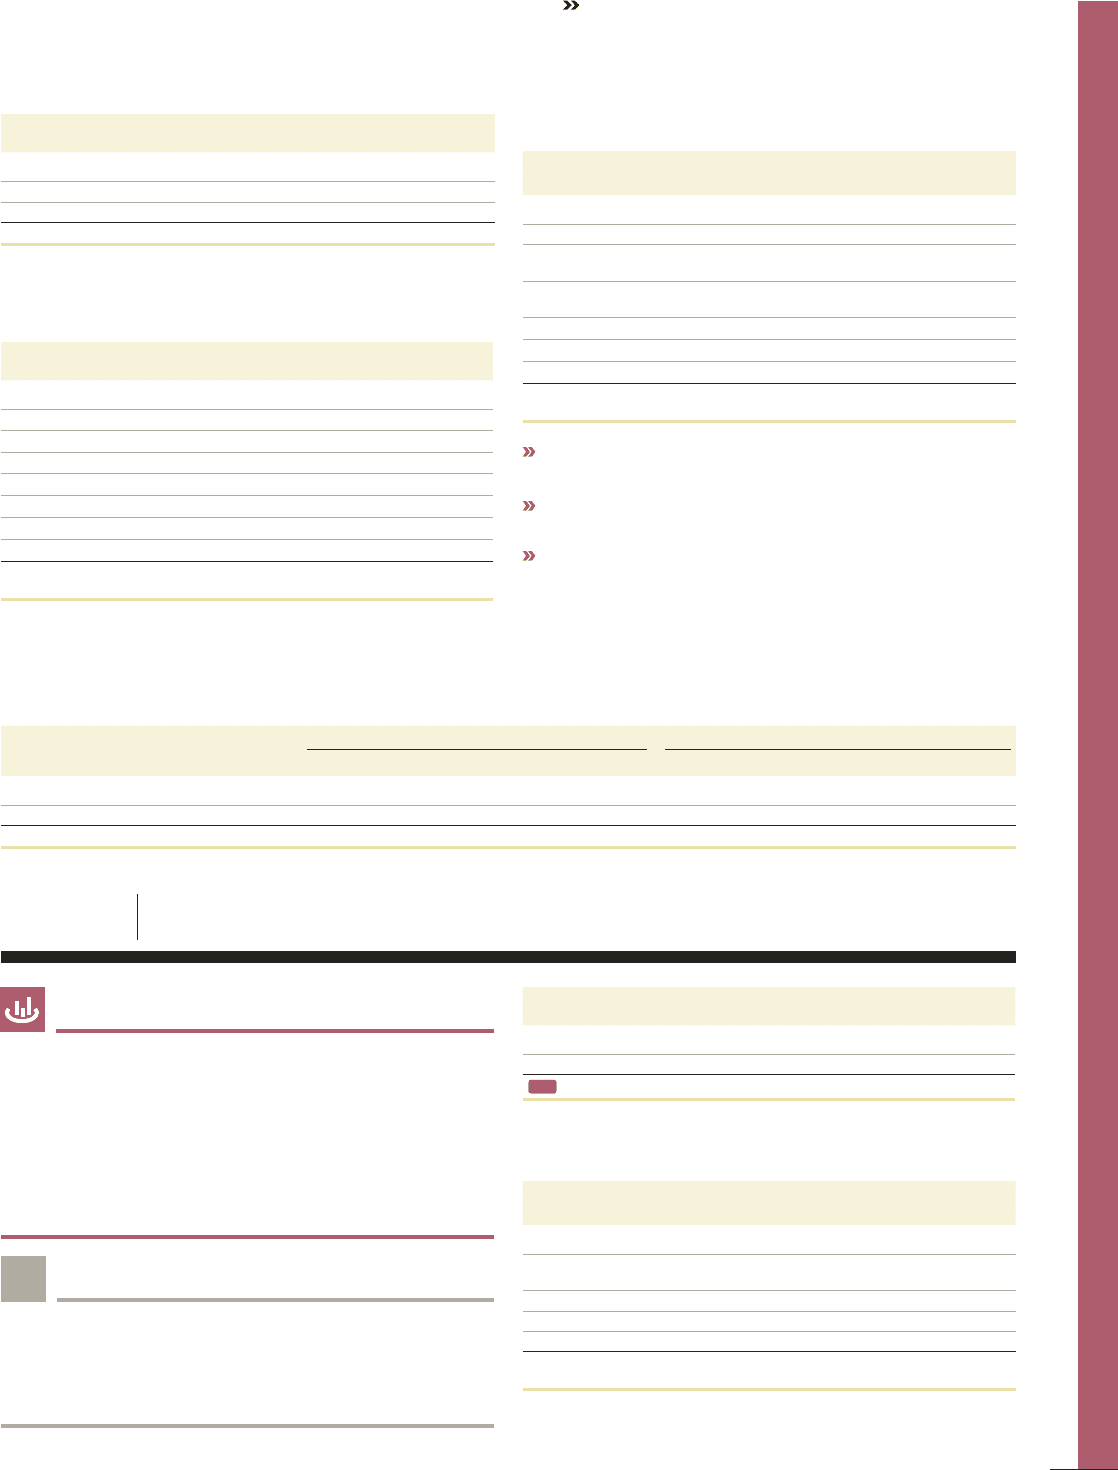
Inventories are recognized at the lower of cost and net realizable value.
The cost is established using the first-in, first-out principle (FIFO) and is
based on the standard cost method, including costs for all direct manu-
facturing expenses and the attributable share of capacity and other
manu facturing-related costs. The standard costs are tested regularly and
adjustments are made based on current conditions. Costs for research
and development, selling, administration and financial expenses are not
in cluded. Net realizable value is calculated as the selling price less costs
attributable to the sale.
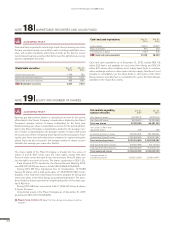
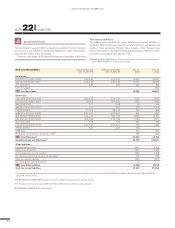
Inventory Dec 31,
2015 Dec 31,
2014
Finished products 27,496 28,368
Production materials, etc. 16,894 17,165
B/S Inventory 44,390 45,533
Inventories recognized as cost of sold produc ts during the period amounted
to SEK 216,778 M (199,872).
Increase (decrease) in allowance
for inventory obsolescence 2015 2014
Opening balance 3,394 2,641
Increase in allowance for inventory obsolescence
charged to income 675 734
Scrapping –435 –395
Translation differences –29 259
Reclassifications etc. 20 154
Allowance for inventory obsolescence
as of December 31 3,624 3,394
ACCOUNTING POLICY
Inventory obsolescence
If the net realizable value is lower than cost, a valuation allowance is
established for inventory obsolescence. The total inventory value, net of
inventory obsolescence allowance, was SEK 44,390 M (45,533) as of
December 31, 2015.
SOURCES OF ESTIMATION UNCERTAINTY
!
NOTE 17 INVENTORIES
GROUP PERFORMANCE 2015 NOTES
137