Volvo 2015 Annual Report Download - page 134
Download and view the complete annual report
Please find page 134 of the 2015 Volvo annual report below. You can navigate through the pages in the report by either clicking on the pages listed below, or by using the keyword search tool below to find specific information within the annual report.-
 1
1 -
2
-
3
-
4
-
5
-
6
-
7
-
8
-
9
-
10
-
11
-
12
-
13
-
14
-
15
-
16
-
17
-
18
-
19
-
20
-
21
-
22
-
23
-
24
-
25
-
26
-
27
-
28
-
29
-
30
-
31
-
32
-
33
-
34
-
35
-
36
-
37
-
38
-
39
-
40
-
41
-
42
-
43
-
44
-
45
-
46
-
47
-
48
-
49
-
50
-
51
-
52
-
53
-
54
-
55
-
56
-
57
-
58
-
59
-
60
-
61
-
62
-
63
-
64
-
65
-
66
-
67
-
68
-
69
-
70
-
71
-
72
-
73
-
74
-
75
-
76
-
77
-
78
-
79
-
80
-
81
-
82
-
83
-
84
-
85
-
86
-
87
-
88
-
89
-
90
-
91
-
92
-
93
-
94
-
95
-
96
-
97
-
98
-
99
-
100
-
101
-
102
-
103
-
104
-
105
-
106
-
107
-
108
-
109
-
110
-
111
-
112
-
113
-
114
-
115
-
116
-
117
-
118
-
119
-
120
-
121
-
122
-
123
-
 124
124 -
 125
125 -
 126
126 -
 127
127 -
 128
128 -
 129
129 -
 130
130 -
 131
131 -
 132
132 -
 133
133 -
 134
134 -
 135
135 -
 136
136 -
 137
137 -
 138
138 -
 139
139 -
 140
140 -
 141
141 -
 142
142 -
 143
143 -
 144
144 -
145
-
146
-
147
-
148
-
149
-
150
-
151
-
152
-
153
-
154
-
155
-
156
-
157
-
158
-
159
-
160
-
161
-
162
-
163
-
164
-
165
-
166
-
167
-
168
-
169
-
170
-
171
-
172
-
173
-
174
-
175
-
176
-
177
-
178
-
179
-
180
-
181
-
182
-
183
-
184
-
185
-
186
-
187
-
188
-
189
-
190
-
191
-
192
-
193
-
194
-
195
-
196
-
197
-
198
-
199
-
200
-
201
-
202
-
203
-
204
 |
 |
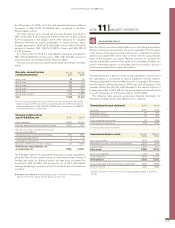
ACCOUNTING POLICY
The Volvo Group applies the cost method for measurement of tangible
assets. Borrowing costs are included in the acquisition value of assets
that are expected to take more than 12 months to complete for their
intended use or sale.
Investment properties are properties owned for the purpose of obtain-
ing rental income and appreciation in value. Investment properties are
recognized at cost. For disclosure purposes, information regarding the
estimated fair value of investment properties is based on an internal dis-
counted cash flow projection. The required return is based on current
property market conditions for comparable properties in comparable
locations. The applied valuation method is classified as level 3 as per the
fair value hierarchy in IFRS 13 and there have not been any changes in
valuation method during the year.
Investment properties are classified as buildings. Land contain land and
land improvements. Machinery is machinery, type-bound tools and other
equipment. Ongoing projects are assets under construction and advanced
payments. Operating leases are assets under operating leases that do not
occur from rental business or sales with residual value commitments.
Rental fleet is assets under operating lease used in a fleet for rental busi-
ness. Sales with residual value commitment is sales that are applying the
operating lease model.
Depreciation and impairment
Property, plant and equipment are depreciated over their useful lives.
Useful lives are based on estimates of the period over which the assets
will generate revenue. Land is not depreciated.
Depreciation is recognized on a straight-line basis based on the cost of
the assets, adjusted in appropriate cases by impairments, and estimated
useful lives. Depreciation is recognized in the respective function to which
it belongs. Impairment tests for depreciable non-current assets are per-
formed if there are indications of impairment at the balance-sheet date.
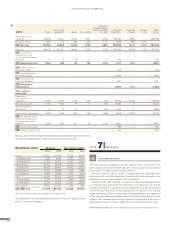
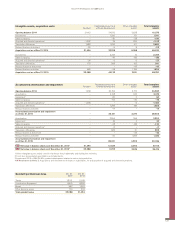
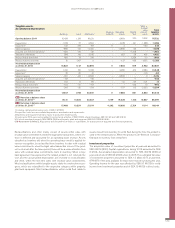
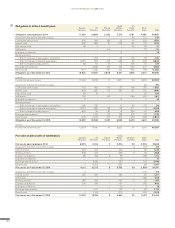
Tangible assets,
Acquisition cost
Buildings Land Machinery3Ongoing
projects Operating
leases Rental
fleet
Sales w.
residual
value
commit-
ments
Total
tangible
assets
Opening balance 2014 30,875 11,164 71,099 4,776 21,366 1,064 13,293 153,637
Investments 796 186 1,592 4,966 10,087 29 –1 17, 6 55
Sales/scrapping –954 –232 –4,767 –61 – 6,704 –10 9 –1 –12,828
Acquired and divested operations
6–1,179 –380 –537 –41 – –6,781 – –8,918
Translation differences 1,723 786 3,735 108 2,406 137 1,327 10,222
Reclassified at divestment 1,088 200 801 46 – 6,781 –18 8,898
Reclassifications and other 1,604 –42 4,108 –5,604 –123 441 188 572
Acquisition costs as of Dec 31, 2014 33,953 11,682 76,031 4,190 27,031 1,562 14,789 169,238
Investments 764 57 2,057 3,746 10,435 – – 17,060
Sales/scrapping –532 –182 –3,699 –20 –9,023 – – –13,456
Acquired and divested operations
6–281 –66 –64 –10 – –4 – –424
Translation differences –142 199 –343 31 30 –146 –238 –608
Reclassified at divestment –176 –202 –967 –37 – –290 18 –1,653
Reclassifications and other 1,248 34 1,779 –3,598 –1,897 2,424 347 337
Acquisition costs as of Dec 31, 2015 34,835 11,522 74,795 4,303 26,578 3,545 14,917 170,494
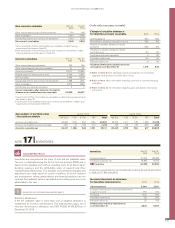
NOTE 13 TANGIBLE ASSETS
Depreciation periods
Type-specific tools 3 to 8 years
Operating leases, Rental fleet 3 to 5 years
Sales with residual value commitments 3 to 5 years
Machinery 5 to 20 years
Buildings and investment properties 20 to 50 years
Land improvements 20 years
SOURCES OF ESTIMATION UNCERTAINTY
!
Impairment of tangible assets
If, at the balance-sheet date, there is any indication that a tangible asset
has been impaired, the recoverable amount of the asset should be esti-
mated. The recoverable amount is the higher of the asset’s net selling
price and its value in use, estimated with reference to management’s pro-
jections of future cash flows. If the recoverable amount of the asset is less
than the carrying amount, an impairment loss is recognized and the carry-
ing amount of the asset is reduced to the recoverable amount. Determina-
tion of the recoverable amount is based upon management’s projections
of future cash flows, which are generally made by use of internal business
plans or forecasts. While management believes that estimates of future
cash flows are reasonable, different assumptions regarding such cash
flows could materially affect valuations.
132
GROUP PERFORMANCE 2015 NOTES