Volvo 2015 Annual Report Download - page 145
Download and view the complete annual report
Please find page 145 of the 2015 Volvo annual report below. You can navigate through the pages in the report by either clicking on the pages listed below, or by using the keyword search tool below to find specific information within the annual report.-
 1
1 -
2
-
3
-
4
-
5
-
6
-
7
-
8
-
9
-
10
-
11
-
12
-
13
-
14
-
15
-
16
-
17
-
18
-
19
-
20
-
21
-
22
-
23
-
24
-
25
-
26
-
27
-
28
-
29
-
30
-
31
-
32
-
33
-
34
-
35
-
36
-
37
-
38
-
39
-
40
-
41
-
42
-
43
-
44
-
45
-
46
-
47
-
48
-
49
-
50
-
51
-
52
-
53
-
54
-
55
-
56
-
57
-
58
-
59
-
60
-
61
-
62
-
63
-
64
-
65
-
66
-
67
-
68
-
69
-
70
-
71
-
72
-
73
-
74
-
75
-
76
-
77
-
78
-
79
-
80
-
81
-
82
-
83
-
84
-
85
-
86
-
87
-
88
-
89
-
90
-
91
-
92
-
93
-
94
-
95
-
96
-
97
-
98
-
99
-
100
-
101
-
102
-
103
-
104
-
105
-
106
-
107
-
108
-
109
-
110
-
111
-
112
-
113
-
114
-
115
-
116
-
117
-
118
-
119
-
120
-
121
-
122
-
123
-
124
-
125
-
126
-
127
-
128
-
129
-
130
-
131
-
132
-
133
-
134
-
 135
135 -
 136
136 -
 137
137 -
 138
138 -
 139
139 -
 140
140 -
 141
141 -
 142
142 -
 143
143 -
 144
144 -
 145
145 -
 146
146 -
 147
147 -
 148
148 -
 149
149 -
 150
150 -
 151
151 -
 152
152 -
 153
153 -
 154
154 -
 155
155 -
156
-
157
-
158
-
159
-
160
-
161
-
162
-
163
-
164
-
165
-
166
-
167
-
168
-
169
-
170
-
171
-
172
-
173
-
174
-
175
-
176
-
177
-
178
-
179
-
180
-
181
-
182
-
183
-
184
-
185
-
186
-
187
-
188
-
189
-
190
-
191
-
192
-
193
-
194
-
195
-
196
-
197
-
198
-
199
-
200
-
201
-
202
-
203
-
204
 |
 |

GROUP PERFORMANCE 2015 NOTES
143
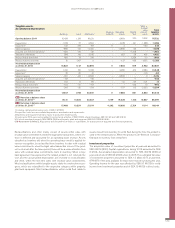
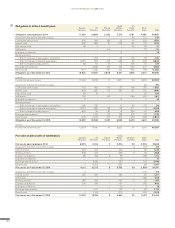
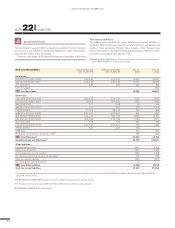
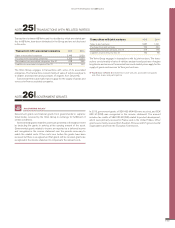
Net provisions for post-employment benefits Sweden
Pensions US
Pensions France
Pensions
Great
Britain
Pensions
US
Other
benefits Other
plans Total
Net provision for post-employment benefits
as of December 31, 2014 –6,320 –1,626 –2,841 101 –3,490 –2,381 –16,557
of which reported as:
B/S Prepaid pensions – – – 101 17 8 126
B/S Provisions for post-employment benefits –6,320 –1,626 –2,841 – –3,507 –2,389 –16,683
Net provisions for post-employment benefits
as of December 31, 2015 –3,032 –2,274 –2,565 27 –3,650 –2,144 –13,638
of which reported as:
B/S Prepaid pensions – – – 27 – 8 34
B/S Provisions for post-employment benefits –3,032 –2,274 –2,565 – –3,650 –2,151 –13,673
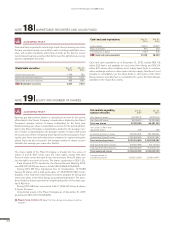
Actual return on plan assets amounted to SEK 964 M (3,050).
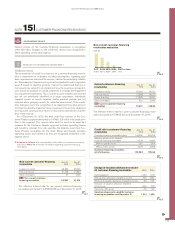
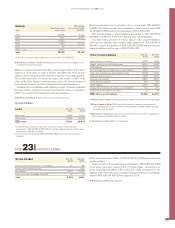
Fair value of plan assets
with a quoted market price Dec 31,
2015 Dec 31,
2014
Cash and cash equivalents 579 194
Equity instruments 13,574 14,550
Debt instruments 13,069 13,398
Real estate 1,653 590
Derivatives –4 –59
Investments funds 3,440 2,880
Assets held by insurance company – –
Other assets 573 623
Total 32,883 32,176
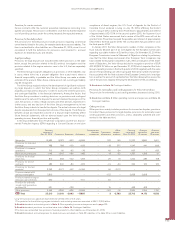
Investment strategy and risk management
The Volvo Group manages the allocation and investment of pension plan
assets with the purpose of meeting the long term objectives. The main
objectives are to meet present and future benefit obligations, provide suf-
ficient liquidity to meet such payment requirements and to provide a total
return that maximizes the ratio of the plan assets in relation to the plan
liabilities by maximizing return on the assets at an appropriate level of risk.
The final investment decision often resides with the local trustee, but the
investment policy for all plans ensures that the risks in the investment
portfolios are well diversified. The risks related to pension obligations, e.g.
longevity and inflation, as well as buy out premiums and matching strate-
gies are monitored on an ongoing basis in order to limit the Volvo Group’s
exposure.
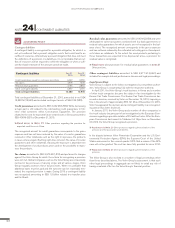
In the last couple of years, some of the defined benefit plans have been
closed to new entrants and replaced by defined contribution plans in
order to reduce risk for the Volvo Group.
In Sweden the minimum funding target is decided by PRI Pensions-
garanti, this is mandatory in order to stay in the system and get insurance
for the pension liability. The minimum contribution is decided by the com-
pany and should equal at least the pension benefits expected to be earned
during the coming year.
In the United States the minimum funding target is decided by the com-
pany in order to avoid penalties, keep flexibility and avoid extensive filing
with the IRS and participants. The minimum contribution should equal at
least the benefits expected to be earned during the coming year plus
one-seventh of the underfunding.
In Great Britain there are no minimum funding requirements. For each
plan there is a contribution plan, which is well defined, in place to bring the
schemes to full funding within a reasonable time frame. The contribution
plans are to be approved by regulators.
In 2016 the Volvo Group estimates to transfer an amount of SEK 1–2
billion to pension plans.
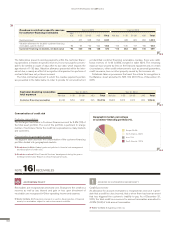
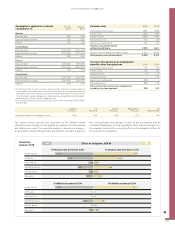
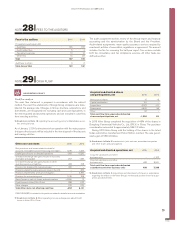
Plan assets by category as of December 31, 2015
Cash and cash equivalents, 589 (2%)
Equity instruments, Volvo, 316 (1%)
Equity instruments, other, 13,259 (37%)
Debt instruments,13,069 (37%)
Real estate, 1,977 (6%)
Investments funds, 4,805 (14%)
Assets held by insurance company, 814 (2%)
Other assets, 572 (2%)
Cash and cash equivalents, 216 (1%)
Equity instruments, Volvo, 359 (1%)
Equity instruments, other, 14,191 (41%)
Debt instruments, 13,398 (39%)
Real estate, 900 (3%)
Investments funds, 3,558 (10%)
Assets held by insurance company, 1,195 (3%)
Other assets, 574 (2%)
Plan assets by category as of December 31, 2014