Volvo 2015 Annual Report Download - page 3
Download and view the complete annual report
Please find page 3 of the 2015 Volvo annual report below. You can navigate through the pages in the report by either clicking on the pages listed below, or by using the keyword search tool below to find specific information within the annual report.-
 1
1 -
 2
2 -
 3
3 -
 4
4 -
 5
5 -
 6
6 -
 7
7 -
 8
8 -
 9
9 -
 10
10 -
 11
11 -
 12
12 -
 13
13 -
 14
14 -
15
-
16
-
17
-
18
-
19
-
20
-
21
-
22
-
23
-
24
-
25
-
26
-
27
-
28
-
29
-
30
-
31
-
32
-
33
-
34
-
35
-
36
-
37
-
38
-
39
-
40
-
41
-
42
-
43
-
44
-
45
-
46
-
47
-
48
-
49
-
50
-
51
-
52
-
53
-
54
-
55
-
56
-
57
-
58
-
59
-
60
-
61
-
62
-
63
-
64
-
65
-
66
-
67
-
68
-
69
-
70
-
71
-
72
-
73
-
74
-
75
-
76
-
77
-
78
-
79
-
80
-
81
-
82
-
83
-
84
-
85
-
86
-
87
-
88
-
89
-
90
-
91
-
92
-
93
-
94
-
95
-
96
-
97
-
98
-
99
-
100
-
101
-
102
-
103
-
104
-
105
-
106
-
107
-
108
-
109
-
110
-
111
-
112
-
113
-
114
-
115
-
116
-
117
-
118
-
119
-
120
-
121
-
122
-
123
-
124
-
125
-
126
-
127
-
128
-
129
-
130
-
131
-
132
-
133
-
134
-
135
-
136
-
137
-
138
-
139
-
140
-
141
-
142
-
143
-
144
-
145
-
146
-
147
-
148
-
149
-
150
-
151
-
152
-
153
-
154
-
155
-
156
-
157
-
158
-
159
-
160
-
161
-
162
-
163
-
164
-
165
-
166
-
167
-
168
-
169
-
170
-
171
-
172
-
173
-
174
-
175
-
176
-
177
-
178
-
179
-
180
-
181
-
182
-
183
-
184
-
185
-
186
-
187
-
188
-
189
-
190
-
191
-
192
-
193
-
194
-
195
-
196
-
197
-
198
-
199
-
200
-
201
-
202
-
203
-
204
 |
 |
Net sales, SEK M 312,515 282,948
Operating income excl.
restructuring charges, SEK M 25,652 8,393
Operating margin excl.
restructuring charges, % 8.2 3.0
Restructuring charges,SEK M –2,333 –2,569
Operating income, SEK M 23,318 5,824
Operating margin, % 7.5 2.1
Income after financial items, SEK M 20,418 5,089
Income for the period, SEK M 15,099 2,235
Diluted earnings per share, SEK 7.41 1.03
Dividend per share, SEK 3.0013.00
1 According to the Board’s proposal.
Operating cash flow,
Industrial Operations, SEK bn 18.3 6.4
Return on shareholders’ equity, % 18.4 2.8
Total number of employees 99,501 104,571
Share of women, % 18 18
Share of women,presidents and
other senior executives, % 21 21
Employee Engagement Index, % 71 72
Energy consumption, MWh/SEK M 6.9 7.9
CO2 emissions, tons/SEK M 0.7 0.8
Water consumption, m3/SEK M 16.2 18.1
Share of direct material purchasing
spend from suppliers having made a
CSR self- assessment, % 86 80
KEY RATIOS 2015 2014 KEY RATIOS 2015 2014
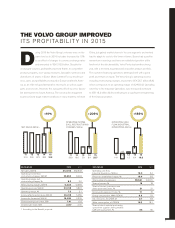
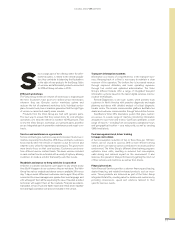
THE VOLVO GROUP IMPROVED
ITS PROFITABILITY IN 2015
NET SALES, SEK bn
13 141211
273 283300310
15
313
OPERATING INCOME
EXCL. RESTRUCTURING
CHARGES, SEK bn
11
26.9
13
7.9
14
8.4
15
25.7
12
19.6
OPERATING CASH
FLOW, INDUSTRIAL
OPERATIONS, SEK bn
14 15131211
6.4 18.31.5
–4.9
14.1
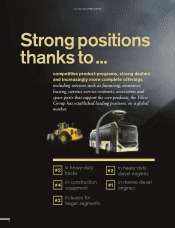
During 2015 the Volvo Group’s volumes were on the
same level as in 2014, but sales increased by 10%
as an effect of changes in currency exchange rates
and amounted to SEK 312.5 billion. Despite the
unchanged volumes, profitability improved thanks to competitive
product programs, cost-saving measures, favorable currencies and
divestitures of shares in Eicher Motor Limited. For our truck busi-
ness, sales and profitability increased in Europe and North Amer-
ica as an effect of good demand for new trucks as well as spare
parts and services. However, this was partly offset by a less favora-
ble development in South America. The construction equipment
business faced tough market conditions in many markets, not least
China, but gained market shares in its core segments and worked
hardto adapt its costs to the lower volumes. Buses had a positive
momentum in earnings and have an established position at the
forefront of theelectromobility. Volvo Penta had another strong
year, with a renewed, expanded and innovative product portfolio.
Thecustomer financing operations developed well with a good
profit and return on equity. The Volvo Group’s operating income,
excluding restructuring charges, improved to SEK 25.7 billion (8.4),
which corresponds to an operating margin of 8.2% (3.0). Operating
cashflow in the Industrial Operations was strong and increased
toSEK 18.3 billion (6.4) contributing to a significant strengthening
of the financial position.
+10% +206% +186%
1