Volvo 2015 Annual Report Download - page 125
Download and view the complete annual report
Please find page 125 of the 2015 Volvo annual report below. You can navigate through the pages in the report by either clicking on the pages listed below, or by using the keyword search tool below to find specific information within the annual report.-
 1
1 -
2
-
3
-
4
-
5
-
6
-
7
-
8
-
9
-
10
-
11
-
12
-
13
-
14
-
15
-
16
-
17
-
18
-
19
-
20
-
21
-
22
-
23
-
24
-
25
-
26
-
27
-
28
-
29
-
30
-
31
-
32
-
33
-
34
-
35
-
36
-
37
-
38
-
39
-
40
-
41
-
42
-
43
-
44
-
45
-
46
-
47
-
48
-
49
-
50
-
51
-
52
-
53
-
54
-
55
-
56
-
57
-
58
-
59
-
60
-
61
-
62
-
63
-
64
-
65
-
66
-
67
-
68
-
69
-
70
-
71
-
72
-
73
-
74
-
75
-
76
-
77
-
78
-
79
-
80
-
81
-
82
-
83
-
84
-
85
-
86
-
87
-
88
-
89
-
90
-
91
-
92
-
93
-
94
-
95
-
96
-
97
-
98
-
99
-
100
-
101
-
102
-
103
-
104
-
105
-
106
-
107
-
108
-
109
-
110
-
111
-
112
-
113
-
114
-
 115
115 -
 116
116 -
 117
117 -
 118
118 -
 119
119 -
 120
120 -
 121
121 -
 122
122 -
 123
123 -
 124
124 -
 125
125 -
 126
126 -
 127
127 -
 128
128 -
 129
129 -
 130
130 -
 131
131 -
 132
132 -
 133
133 -
 134
134 -
 135
135 -
136
-
137
-
138
-
139
-
140
-
141
-
142
-
143
-
144
-
145
-
146
-
147
-
148
-
149
-
150
-
151
-
152
-
153
-
154
-
155
-
156
-
157
-
158
-
159
-
160
-
161
-
162
-
163
-
164
-
165
-
166
-
167
-
168
-
169
-
170
-
171
-
172
-
173
-
174
-
175
-
176
-
177
-
178
-
179
-
180
-
181
-
182
-
183
-
184
-
185
-
186
-
187
-
188
-
189
-
190
-
191
-
192
-
193
-
194
-
195
-
196
-
197
-
198
-
199
-
200
-
201
-
202
-
203
-
204
 |
 |

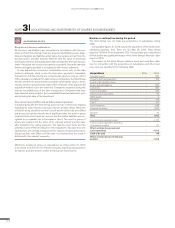
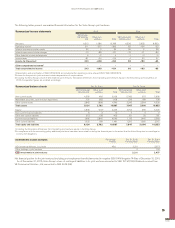
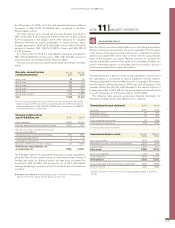
The following tables present summarized financial information for the Volvo Group’s joint ventures:
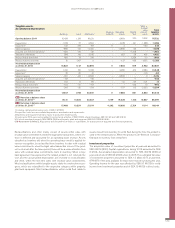
Summarized income statements 2015 2014
VE Commer-
cial Vehicles,
Ltd. Other joint
ventures Total VE Commercial
Vehicles, Ltd. Other joint
ventures Total
Net sales 9,212 1,586 10,798 6,208 2,622 8,830
Operating income
1311 –577 –266 82 –134 –52
Interest income and similar credits 22 3 25 26 2 28
Interest expense and similar charges –13 –88 –101 –13 –71 –84
Other financial income and expenses 6 –2 4 –1 –3 –4
Income taxes –81 –34 –116 4 23 27
Income for the period2243 –698 –454 98 –183 –85
Other comprehensive income3–– – –––
Total comprehensive income 243 –698 –454 98 –183 –85
1 Depreciation and amortization of SEK 372 M (303) are included within operating income whereof VECV SEK 338 M (273).
2 Income for the period in joint ventures includes depreciation of surplus values.
3 Including the Volvo Group’s share of OCI related to joint ventures. Translation differences from translating joint ventures equity in the Volvo Group are excluded as of
2015. Comparative figures are restated accordingly.
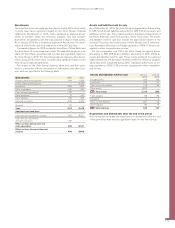
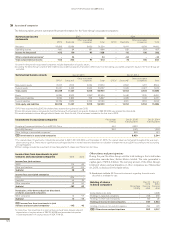
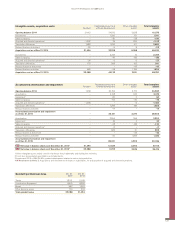
Summarized balance sheets Dec 31, 2015 Dec 31, 2014
VE Commercial
Vehicles, Ltd. Other joint
ventures Total VE Commercial
Vehicles, Ltd. Other joint
ventures Total
Non-current assets 4,556 483 5,039 5,083 553 5,636
Marketable securities, cash and cash equivalents 727 382 1,108 519 189 708
Other current assets 2,842 1,898 4,740 2,245 2,264 4,509
Total assets 8,124 2,762 10,887 7,847 3,006 10,853
Equity14,848 –40224,446 4,754 266 5,020
Non-current financial liabilities 8 2 10 7 0 7
Other non-currentliabilities 272 128 400 721 30 751
Current financial liabilities 1,695 2,845 4,540 1,115 1,445 2,560
Other current liabilities 1,302 189 1,491 1,250 1,265 2,515
Total equity and liabilities 8,124 2,762 10,887 7,847 3,006 10,853
1 Including the translation differences from translating joint ventures equity in the Volvo Group.
2 In compliance with the accounting policy additional provisions have been accounted for during the financial year to the extent that the Volvo Group has incurred legal or
constructive obligations.
Investments in joint ventures Percentage
holding Dec 31, 2015
Carrying value Dec 31, 2014
Carrying value
VE Commercial Vehicles., Ltd., India 45.6 2,211 2,377
Other holdings in joint ventures –0100
B/S Investments in joint ventures 2,211 2,477
Net financial position for the joint ventures (excluding post-employment benefits) amounted to negative SEK 514 M (negative 744) as of December 31, 2015.
As of December 31, 2015, Volvo Group’s share of contingent liabilities in its joint ventures amounted to SEK 157 M (106). Dividend received from
VE Commercial Vehicles., Ltd, amounted to SEK 46 M (36).
GROUP PERFORMANCE 2015 NOTES
123