Volvo 2015 Annual Report Download - page 200
Download and view the complete annual report
Please find page 200 of the 2015 Volvo annual report below. You can navigate through the pages in the report by either clicking on the pages listed below, or by using the keyword search tool below to find specific information within the annual report.-
 1
1 -
2
-
3
-
4
-
5
-
6
-
7
-
8
-
9
-
10
-
11
-
12
-
13
-
14
-
15
-
16
-
17
-
18
-
19
-
20
-
21
-
22
-
23
-
24
-
25
-
26
-
27
-
28
-
29
-
30
-
31
-
32
-
33
-
34
-
35
-
36
-
37
-
38
-
39
-
40
-
41
-
42
-
43
-
44
-
45
-
46
-
47
-
48
-
49
-
50
-
51
-
52
-
53
-
54
-
55
-
56
-
57
-
58
-
59
-
60
-
61
-
62
-
63
-
64
-
65
-
66
-
67
-
68
-
69
-
70
-
71
-
72
-
73
-
74
-
75
-
76
-
77
-
78
-
79
-
80
-
81
-
82
-
83
-
84
-
85
-
86
-
87
-
88
-
89
-
90
-
91
-
92
-
93
-
94
-
95
-
96
-
97
-
98
-
99
-
100
-
101
-
102
-
103
-
104
-
105
-
106
-
107
-
108
-
109
-
110
-
111
-
112
-
113
-
114
-
115
-
116
-
117
-
118
-
119
-
120
-
121
-
122
-
123
-
124
-
125
-
126
-
127
-
128
-
129
-
130
-
131
-
132
-
133
-
134
-
135
-
136
-
137
-
138
-
139
-
140
-
141
-
142
-
143
-
144
-
145
-
146
-
147
-
148
-
149
-
150
-
151
-
152
-
153
-
154
-
155
-
156
-
157
-
158
-
159
-
160
-
161
-
162
-
163
-
164
-
165
-
166
-
167
-
168
-
169
-
170
-
171
-
172
-
173
-
174
-
175
-
176
-
177
-
178
-
179
-
180
-
181
-
182
-
183
-
184
-
185
-
186
-
187
-
188
-
189
-
 190
190 -
 191
191 -
 192
192 -
 193
193 -
 194
194 -
 195
195 -
 196
196 -
 197
197 -
 198
198 -
 199
199 -
 200
200 -
 201
201 -
 202
202 -
 203
203 -
 204
204
 |
 |

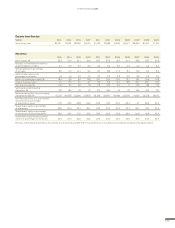
Operating margin
% 2015 2014 2013 2012 2011 2010 2009 2008 2007 2006 2005
Trucks 9.1 2.2 3.4 5.3 9.2 6.0 –7.8 6.0 8.1 7.7 7.5
Buses 3.6 0.5 –1.1 0.3 5.1 3.8 –1.9 –0.4 1.4 4.3 2.8
Construction Equipment 4.0 1.2 4.9 9.1 10.7 11.5 –11.2 3.2 7.9 9.7 7.9
Volvo Penta 11.5 9.3 8.3 7.1 9.8 6.6 –2.8 8.1 10.0 10.3 9.6
Volvo Aero –––14.75.73.70.64.86.94.411.1
Volvo Group Industrial
Operations 7. 0 1.5 2.1 5.4 8 .5 6.9 –7. 8 5.2 7.8 7.9 7.9
Customer Finance 17.9 16.9 16.0 15.3 10.9 1.8 –5.8 16.5 21.4 22.0 26.9
Volvo Group 7.5 2.1 2.6 5.8 8.7 6 . 8 –7. 8 5.2 7. 8 7.9 7. 5
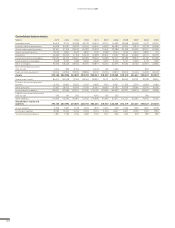
Operating income
SEK M 201552014420133201222011 2010 2009 2008 2007 200612005
Trucks 19,517 4,157 6,145 10,216 18,227 10,112 –10,805 12,167 15,193 13,116 11,717
Buses 860 92 –190 51 1,114 780 –350 –76 231 745 470
Construction Equipment 2,044 652 2,592 5,773 6,812 6,180 –4,005 1,808 4,218 4,072 2,752
Volvo Penta 1,086 724 626 541 825 578 –230 928 1,173 1,105 943
Volvo Aero – – – 767 360 286 50 359 529 359 836
Customer Finance 2,006 1,712 1,522 1,492 969 167 –680 1,397 1,649 1,686 2,033
Other –2,195 –1, 514 –3,557 –1,217 –1,408 –102 –994 –731 –762 –684 –598
Operating income/loss
Volvo Group 23,318 5,824 7,138 17,622 26,899 18,000 –17,013 15,851 22,231 20,399 18,153
Between 2007 and 2011, the benefits from the synergies created in the business
units are transferred back to the various business areas. Comparison figures for
2006 have been restated.
1 Operating income in 2006 included adjustment of goodwill of neg 1,712,
reported in Trucks.
2 Volvo Aero was divested October 1, 2012.
3 Operating income in 2013 included a revaluation of neg 1,500 related to Volvo
Rents, reported in Other.
4 Operating income in 2014 included provisions of 4,450 for pending EU antitrust
investigation of 3,790 and expected credit losses of 660.
5 Operating income in 2014 included a capital gain of SEK 4,608 M from a sale of
shares in Eicher Motors Limited.
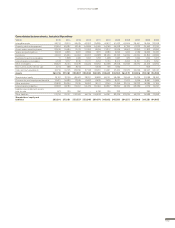
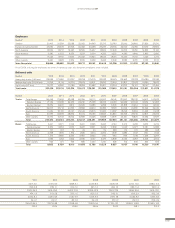
Number of employees at year-end
Number1, 2, 3 2015 2014 2013 2012 2011 2010 2009 2008 2007 2006 2005
Trucks 54,668 58,067 58,542 61,256 62,315 57,796 56,505 64,280 64,390 49,900 50,240
Buses 7,270 6,900 6,648 7,514 8,529 8,685 9,541 8,930 9,290 7,760 7,710
Construction Equipment 13,889 14,901 14,663 14,788 18,422 16,648 16,126 19,810 19,710 11,050 10,290
Volvo Penta 1,470 1,422 1,412 1,361 2,549 2,353 2,928 2,940 3,000 1,650 1,560
Volvo Aero – – – – 3,179 3,120 3,278 3,510 3,550 3,510 3,460
Financial Services 1,340 1,339 1,355 1,362 1,323 1,235 1,234 1,290 1,150 1,010 1,070
Other 9,827 10,193 12,913 12,436 1,845 572 596 620 610 8,310 7,530
Volvo Group, total 88,464 92,822 95,533 98,717 98,162 90,409 90,208 101,380 101,700 83,190 81,860
1 Between 2007 and 2011, employees in business units are allocated to the business areas.
2 As of 2009, only regular employees are shown, for previous years also temporary employees were included.
3 As of 2012, employees in business units are not allocated to the business areas.
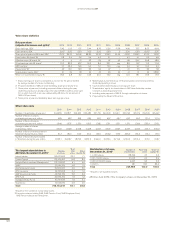
1 Restated according to new accounting rules.
2 Excluding UD Trucks and Ingersoll Rand Road Development.
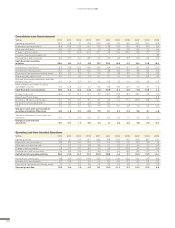
Environmental performance of Volvo production plants, Industrial operations
Absolute values related to net sales 2015 2014 2013 20121
Energy consumption (GWh; MWh/SEK M) 2,106; 6.9 2,176; 7.9 2,536; 9.6 2,518; 8.6
CO2 emissions (1,000 tons; tons/SEK M) 221; 0.7 231; 0.8 280; 1.1 235; 0.8
Water consumption (1,000 m3; m3/SEK M) 4,919; 16.2 4,982; 18.1 5,815; 21.9 7,372; 25.2
NOx emissions (tons; kilos/SEK M) 344; 1.3 332; 1.2 347; 1.3 413; 1.4
Solvent emissions (tons; kilos/SEK M) 1,885; 6.2 2,472; 9.0 2,221; 8.4 2,358; 8.1
Sulphur dioxide emissions (tons; kilos/SEK M) 32.1; 0.1 37.9; 0.1 23.4; 0.1 26; 0.1
Hazardous waste (tons; kg/SEK M) 27,824; 91.6 24,944; 90.4 28,395; 107.0 32,547; 111.4
Net sales, SEK bn 303.6 276.0 265.4 292.2
OTHER INFORMATION
198