Volvo 2015 Annual Report Download - page 158
Download and view the complete annual report
Please find page 158 of the 2015 Volvo annual report below. You can navigate through the pages in the report by either clicking on the pages listed below, or by using the keyword search tool below to find specific information within the annual report.-
 1
1 -
2
-
3
-
4
-
5
-
6
-
7
-
8
-
9
-
10
-
11
-
12
-
13
-
14
-
15
-
16
-
17
-
18
-
19
-
20
-
21
-
22
-
23
-
24
-
25
-
26
-
27
-
28
-
29
-
30
-
31
-
32
-
33
-
34
-
35
-
36
-
37
-
38
-
39
-
40
-
41
-
42
-
43
-
44
-
45
-
46
-
47
-
48
-
49
-
50
-
51
-
52
-
53
-
54
-
55
-
56
-
57
-
58
-
59
-
60
-
61
-
62
-
63
-
64
-
65
-
66
-
67
-
68
-
69
-
70
-
71
-
72
-
73
-
74
-
75
-
76
-
77
-
78
-
79
-
80
-
81
-
82
-
83
-
84
-
85
-
86
-
87
-
88
-
89
-
90
-
91
-
92
-
93
-
94
-
95
-
96
-
97
-
98
-
99
-
100
-
101
-
102
-
103
-
104
-
105
-
106
-
107
-
108
-
109
-
110
-
111
-
112
-
113
-
114
-
115
-
116
-
117
-
118
-
119
-
120
-
121
-
122
-
123
-
124
-
125
-
126
-
127
-
128
-
129
-
130
-
131
-
132
-
133
-
134
-
135
-
136
-
137
-
138
-
139
-
140
-
141
-
142
-
143
-
144
-
145
-
146
-
147
-
 148
148 -
 149
149 -
 150
150 -
 151
151 -
 152
152 -
 153
153 -
 154
154 -
 155
155 -
 156
156 -
 157
157 -
 158
158 -
 159
159 -
 160
160 -
 161
161 -
 162
162 -
 163
163 -
 164
164 -
 165
165 -
 166
166 -
 167
167 -
 168
168 -
169
-
170
-
171
-
172
-
173
-
174
-
175
-
176
-
177
-
178
-
179
-
180
-
181
-
182
-
183
-
184
-
185
-
186
-
187
-
188
-
189
-
190
-
191
-
192
-
193
-
194
-
195
-
196
-
197
-
198
-
199
-
200
-
201
-
202
-
203
-
204
 |
 |

156
GROUP PERFORMANCE 2015 NOTES
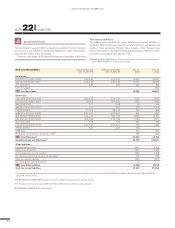
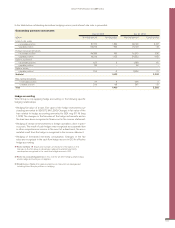
Reported in operating income12015 2014
SEK M Gains/
losses Interest
income Interest
expenses7Gains/
losses Interest
income Interest
expenses7
Financial assets and liabilities at fair value
through the income statement2
Currency risk derivatives3–11–– –42––
Loans receivable and other receivables
Accounts receivables / trade payables
1–913–– –1,190––
Customer financing receivables VFS
175 5,128 – 89 4,829 –
Financial assets available for sale
Shares and participations for which a market value can be calculated 64,650–– 55––
Shares and participations for which a market value cannot be calculated 28 – – 16 – –
Financial liabilities valued at amortized cost4––1,945 – ––1,847
Effect on operating income 3,829 5,128 –1,945 –1,072 4,829 –1,847
Reported in net financial items5, 7
Financial assets and liabilities at fair value
through the income statement
Marketable securities – 14 – 46 –
Interest and currency rate risk derivatives2, 3 298 1 –208 1,567 9 99
Loans receivable and other receivables
Cash and Cash equivalents – 242 – 273 –
Financial liabilities valued at amortized cost –841 –1,698 –391 – –1,661
Effect on net financial items 5 , 7 –543 257 –1,906 1,176 328 –1,562
1 Information is provided regarding changes in provisions for doubtful receivables
and customer financing in Notes 15 and 16, Accounts receivable and customer
financing receivables, as well as in Note 8, Other operating income and expenses.
2 Accrued and realized interest is included in gains and losses related to Financial
assets and liabilities at fair value through the income statement.
3 The Volvo Group uses forward contracts and currency options to hedge the
value of future cash flows in foreign currency. Both unrealized and realized result
on currency risk contracts is included in the table. Read more in Note 4, Goals
and policies in financial risk management.
4 Interest expenses attributable to financial liabilities valued at amortized cost
recognized in operating income include interest expenses for financing operat-
ing lease activities, which are not classified as a Financial Instrument.
5 In gains, losses, income and expenses related to financial instruments
recognized in Net financial items, negative SEK 543 M (1,176) was recognized
under other financial income and expenses.
6 During 2015 Volvo Group sold the holding of the shares in the listed Indian auto-
motive manufacturer Eicher Motors Limited. The sale generated a gain of SEK
4.6 billion.
7 Interest expenses reported in net financial items attributable to pensions, SEK
460 M (432) arenot included in this table.
Read more in Note 9, Other financial income and expenses for further
information.
Read more in Note 5 Investments in joint ventures, associated companies
and other shares and participations for further information about the divest-
ments of the shares in Eicher Motors limited.
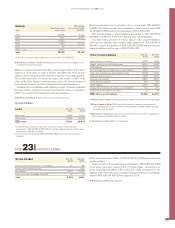
Derecognition of financial assets
The Volvo Group is involved in cash enhancement activities such as factoring
and discounting. Financial assets that have been transferred are included
in full or in part in the reported assets of the Volvo Group dependent on
the risk and rewards related to the asset that have been transferred to the
recipient. In accordance with IAS 39, Financial Instruments, Recognition
and Measurement, an evaluation is performed to establish whether, sub-
stantially, all the risks and rewards have been transferred to an external
party. Where the Volvo Group concludes this is not the case, the portion
of the financial assets corresponding to the Volvo Group’s continuous
involvement is recognized. When all the risk and rewards are not consid-
ered to be transferred the amount is kept on the balance sheet. Trans-
ferred financial asset that does not fulfill the requirements for derecogni-
tion amounted to SEK 0.4 bn (0.1).
Transferred financial assets for which substantially all risks and rewards
have been transferred are derecognized continuously. Involvement in
these assets are reflected in the Volvo Group’s balance sheet as part of
the external credit guarantees, which are recognized at fair value as provi-
sions in the balance sheet and amounted to SEK 520 M (650).
The Volvo Group’s maximum exposure to loss is considered being the
total recourse relating to transferred assets that are part of the reported
credit guarantees, i.e. the total amount Volvo Group would have to pay in
case of default of the customers. The likelihood for all customers being in
default at the same time is considered to be unlikely. The gross exposure
for the Volvo Group amounted to SEK 3.4 billion (6.6) related to credit
guarantees issued for customers and others which is part of the Volvo
Group’s contingent liabilities. This amount has not been reduced by the
value of counter guarantees received or other collaterals such as the right
to repossess the product.
Read more in Note 21 regarding Other provisions
Read more in Note 24 regarding Contingent Liabilities.
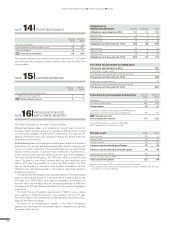
Gains, losses, interest income and expenses from
financial instruments
The table below shows how gains and losses as well as interest income
and expenses have affected income after financial items in the Volvo
Group divided on the different categories of financial instruments.