Volvo 2015 Annual Report Download - page 35
Download and view the complete annual report
Please find page 35 of the 2015 Volvo annual report below. You can navigate through the pages in the report by either clicking on the pages listed below, or by using the keyword search tool below to find specific information within the annual report.-
 1
1 -
2
-
3
-
4
-
5
-
6
-
7
-
8
-
9
-
10
-
11
-
12
-
13
-
14
-
15
-
16
-
17
-
18
-
19
-
20
-
21
-
22
-
23
-
24
-
 25
25 -
 26
26 -
 27
27 -
 28
28 -
 29
29 -
 30
30 -
 31
31 -
 32
32 -
 33
33 -
 34
34 -
 35
35 -
 36
36 -
 37
37 -
 38
38 -
 39
39 -
 40
40 -
 41
41 -
 42
42 -
 43
43 -
 44
44 -
 45
45 -
46
-
47
-
48
-
49
-
50
-
51
-
52
-
53
-
54
-
55
-
56
-
57
-
58
-
59
-
60
-
61
-
62
-
63
-
64
-
65
-
66
-
67
-
68
-
69
-
70
-
71
-
72
-
73
-
74
-
75
-
76
-
77
-
78
-
79
-
80
-
81
-
82
-
83
-
84
-
85
-
86
-
87
-
88
-
89
-
90
-
91
-
92
-
93
-
94
-
95
-
96
-
97
-
98
-
99
-
100
-
101
-
102
-
103
-
104
-
105
-
106
-
107
-
108
-
109
-
110
-
111
-
112
-
113
-
114
-
115
-
116
-
117
-
118
-
119
-
120
-
121
-
122
-
123
-
124
-
125
-
126
-
127
-
128
-
129
-
130
-
131
-
132
-
133
-
134
-
135
-
136
-
137
-
138
-
139
-
140
-
141
-
142
-
143
-
144
-
145
-
146
-
147
-
148
-
149
-
150
-
151
-
152
-
153
-
154
-
155
-
156
-
157
-
158
-
159
-
160
-
161
-
162
-
163
-
164
-
165
-
166
-
167
-
168
-
169
-
170
-
171
-
172
-
173
-
174
-
175
-
176
-
177
-
178
-
179
-
180
-
181
-
182
-
183
-
184
-
185
-
186
-
187
-
188
-
189
-
190
-
191
-
192
-
193
-
194
-
195
-
196
-
197
-
198
-
199
-
200
-
201
-
202
-
203
-
204
 |
 |
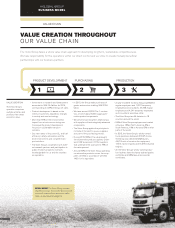
A GLOBAL GROUP BUSINESS MODEL PRODUCTION
Environmental performance
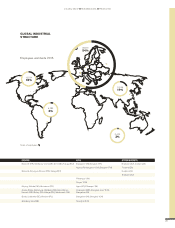
In 2015, we had 15 licensed facilities in Sweden. The permits
cover general conditions for the operations such as allowed pro-
duction volumes and the environmental performance. All permits
have specific site requirements related to impact on neighbours
and environment. No environmental permits are deemed to be
renewed for 2016. There were no major environmental incidents
reported for the Volvo Group during 2015. The Group has reported
environmental data since 1991. The latest quantitative data is
presented in the table below.
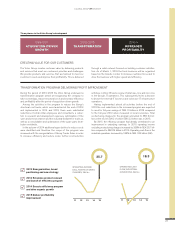
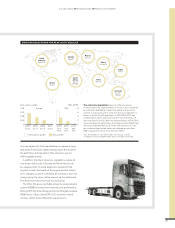
Energy efficiency
The Group’s 2015 total energy consumption amounted to 2,106
GWh, a reduction of 70 GWh compared to 2014. The main activity
behind the reduction was increased energy efficiency. By reduc-
ing energy, we both reduce costs and lower emissions. Between
2005 and 2015, the Volvo Group decreased energy consumption
in our own production processes by roughly 20% in absolute
terms. This means that the energy cost for 2015 has decreased
with more than SEK 500 M thanks to energy efficency activities.
The accumulated saving is significantly larger.
For example, Volvo Construction Equipment has reduced elec-
tricity consumption by focusing on idle time. By changing behav-
ior, electricity consumption during idle time at the six largest
plants has been reduced by 19% in 2015 and by 39% overall
since 2012. This is equivalent to heating 343 houses in Sweden
for a full year.
Our energy efficiency index, which compares energy consum-
pion with net sales, was 6.9 MWh/SEK M in 2015, compared with
7.9 MWh/SEK M in 2014. The 2015 energy efficiency index has
thereby improved 13% since 2014.
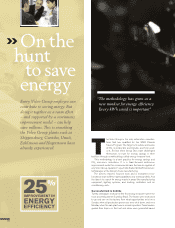
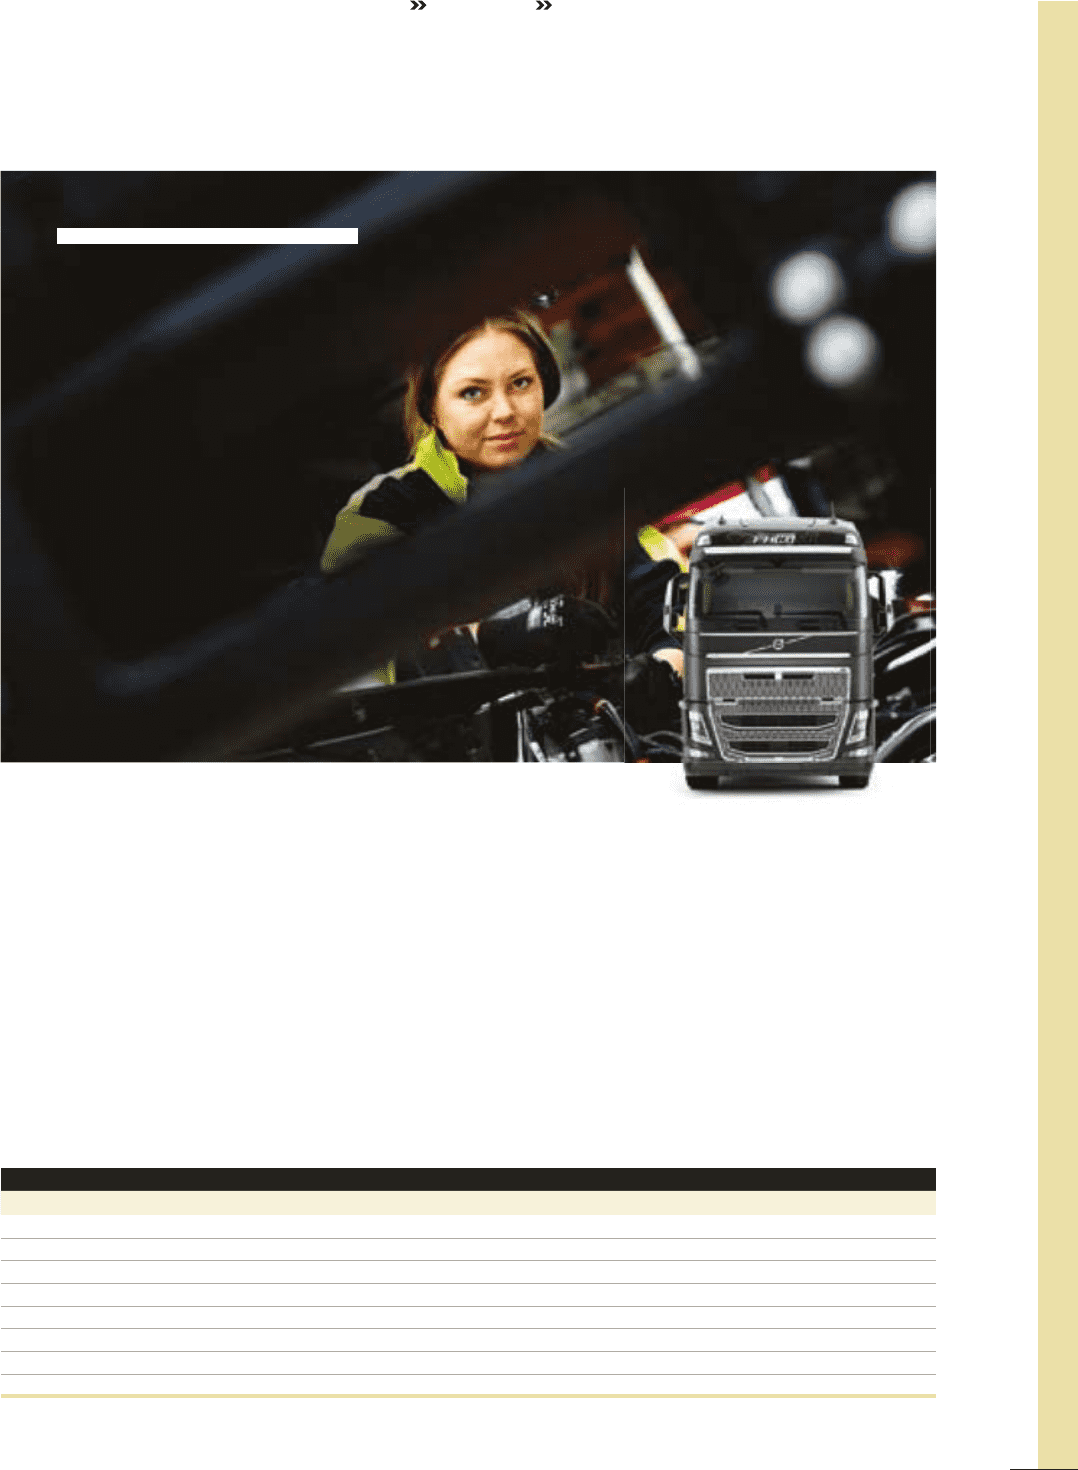
EFFICIENCY
THROUGH HEALTH
AND SAFETY
Our ambition is for zero accidents
withour products for our
employees and our customers.
Our strategy to achieve this in the work-
place includes providing safe and healthy
working conditions to support a sustainable
and high-performing workforce.
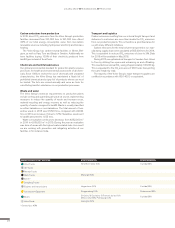
ENVIRONMENTAL PERFORMANCE OF VOLVO PRODUCTION PLANTS, INDUSTRIAL OPERATIONS
Absolute values related to net sales 2015 2014 2013 20121
Energy consumption (GWh; MWh/SEK M) 2,106; 6.9 2,176; 7.9 2,536; 9.6 2,518; 8.6
CO2 emissions (1,000 tons; tons/SEK M) 221; 0.7 231; 0.8 280; 1.1 235; 0.8
Water consumption (1,000 m3; m3/SEK M) 4,919; 16.2 4,982; 18.1 5,815; 21.9 7,372; 25.2
NOx emissions (tons; kilos/SEK M) 344; 1.3 332; 1.2 347; 1.3 413; 1.4
Solvent emissions (tons; kilos/SEK M) 1,885; 6.2 2,472; 9.0 2,221; 8.4 2,358; 8.1
Sulphur dioxide emissions (tons; kilos/SEK M) 32.1; 0.1 37.9; 0.1 23.4; 0.1 26; 0.1
Hazardous waste (tons; kg/SEK M) 27,824; 91.6 24,944; 90.4 28,395; 107.0 32,547; 111.4
Net sales, SEK bn 303.6 276.0 265.4 292.2
1 Restated according to new accounting rules.
33