Volvo 2015 Annual Report Download - page 36
Download and view the complete annual report
Please find page 36 of the 2015 Volvo annual report below. You can navigate through the pages in the report by either clicking on the pages listed below, or by using the keyword search tool below to find specific information within the annual report.-
 1
1 -
2
-
3
-
4
-
5
-
6
-
7
-
8
-
9
-
10
-
11
-
12
-
13
-
14
-
15
-
16
-
17
-
18
-
19
-
20
-
21
-
22
-
23
-
24
-
25
-
 26
26 -
 27
27 -
 28
28 -
 29
29 -
 30
30 -
 31
31 -
 32
32 -
 33
33 -
 34
34 -
 35
35 -
 36
36 -
 37
37 -
 38
38 -
 39
39 -
 40
40 -
 41
41 -
 42
42 -
 43
43 -
 44
44 -
 45
45 -
 46
46 -
47
-
48
-
49
-
50
-
51
-
52
-
53
-
54
-
55
-
56
-
57
-
58
-
59
-
60
-
61
-
62
-
63
-
64
-
65
-
66
-
67
-
68
-
69
-
70
-
71
-
72
-
73
-
74
-
75
-
76
-
77
-
78
-
79
-
80
-
81
-
82
-
83
-
84
-
85
-
86
-
87
-
88
-
89
-
90
-
91
-
92
-
93
-
94
-
95
-
96
-
97
-
98
-
99
-
100
-
101
-
102
-
103
-
104
-
105
-
106
-
107
-
108
-
109
-
110
-
111
-
112
-
113
-
114
-
115
-
116
-
117
-
118
-
119
-
120
-
121
-
122
-
123
-
124
-
125
-
126
-
127
-
128
-
129
-
130
-
131
-
132
-
133
-
134
-
135
-
136
-
137
-
138
-
139
-
140
-
141
-
142
-
143
-
144
-
145
-
146
-
147
-
148
-
149
-
150
-
151
-
152
-
153
-
154
-
155
-
156
-
157
-
158
-
159
-
160
-
161
-
162
-
163
-
164
-
165
-
166
-
167
-
168
-
169
-
170
-
171
-
172
-
173
-
174
-
175
-
176
-
177
-
178
-
179
-
180
-
181
-
182
-
183
-
184
-
185
-
186
-
187
-
188
-
189
-
190
-
191
-
192
-
193
-
194
-
195
-
196
-
197
-
198
-
199
-
200
-
201
-
202
-
203
-
204
 |
 |
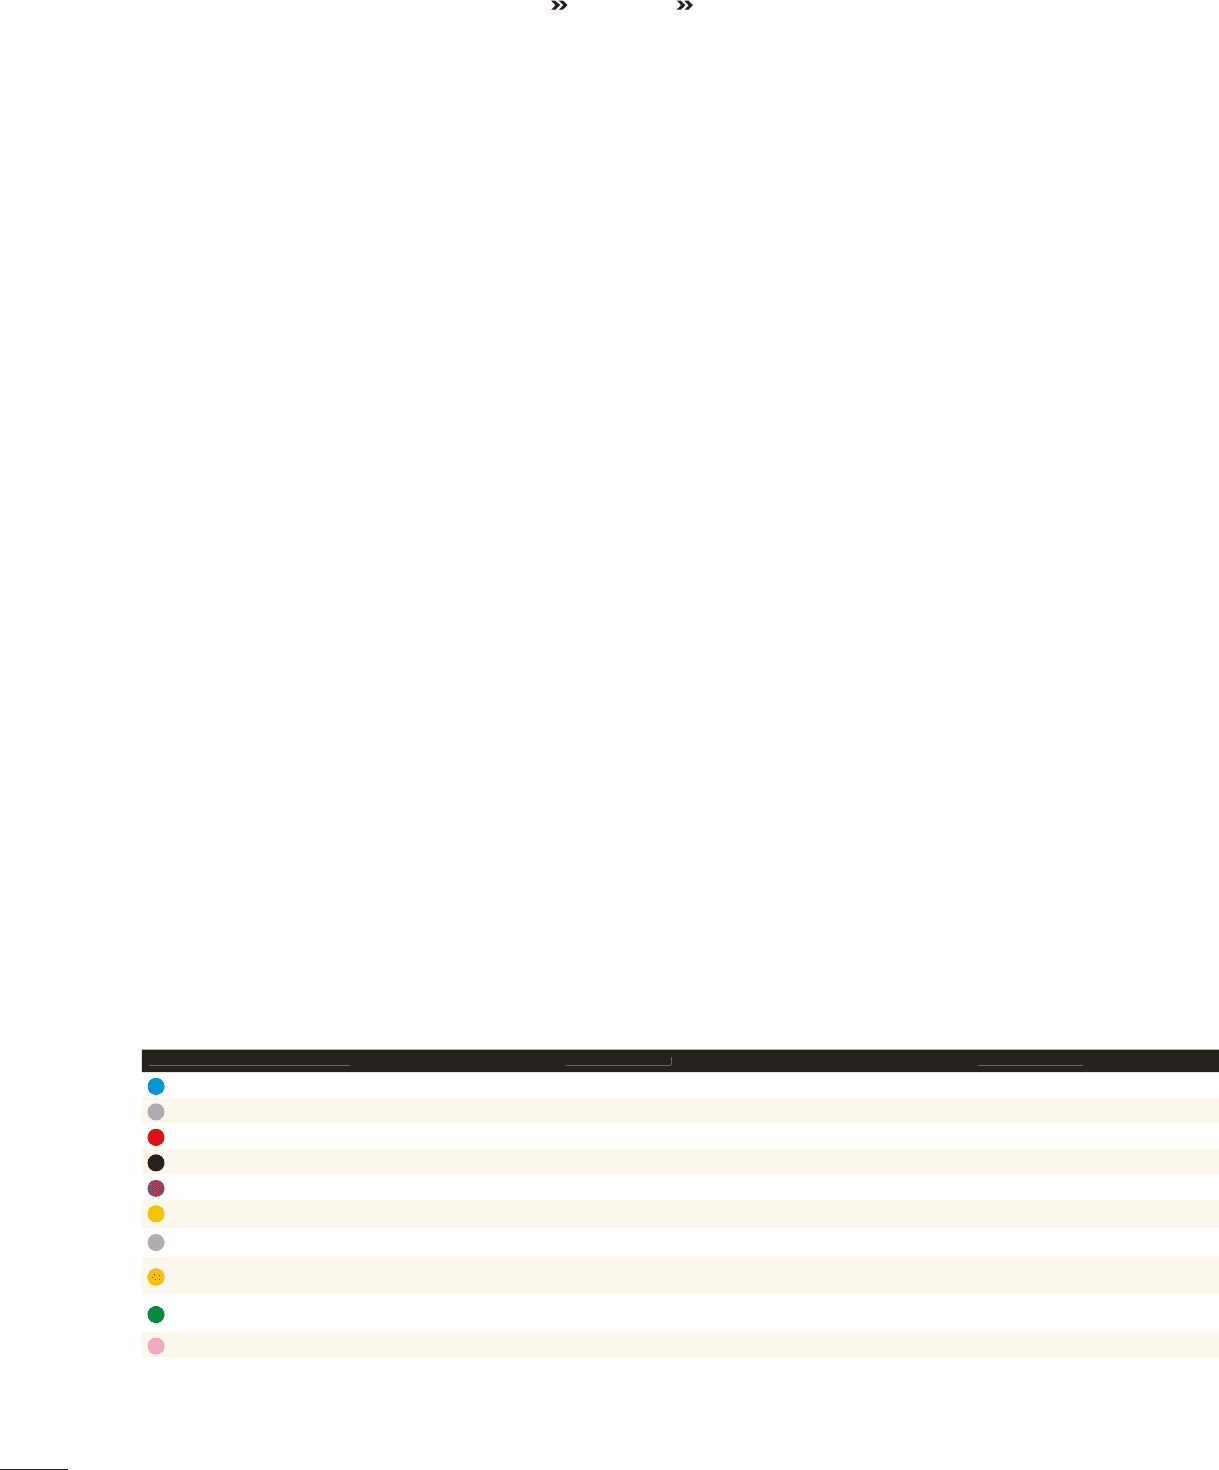
A GLOBAL GROUP BUSINESS MODEL PRODUCTION
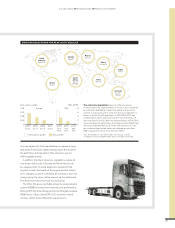
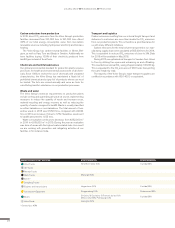
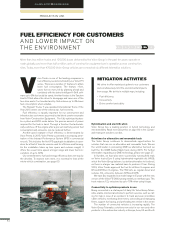
Carbon emissions from production
In 2015, direct CO2 emissions from the Volvo Group’s production
facilities decreased from 231,000 tons to 221,000 tons. About
40% of our total energy consumption came from low-carbon
renewable sources, including hydropower electricity and biomass
heating.
The Volvo Group has carbon-neutral facilities in Ghent, Bel-
gium, as well as Vara, Tuve and Braås in Sweden. Additionally we
have facilities buying 100% of their electricity produced from
landfill gas instead of fossil fuels.
Chemicals and harmful substances
Our global environmental standard for production plants requires
processes for health and environmental assessment of all chem-
icals. Since 1996, to restrict the use of chemicals with unwanted
characteristics, the Volvo Group has maintained a ‘black list’ of
prohibited chemicals and a ‘grey list’ of products whose use must
be limited. The lists are revised annually and serve as tools for
substituting harmful substances in our production processes.
Waste and water
The Volvo Group’s minimum requirements on production plants
include sorting and quantifying all waste at source, implementing
measures to reduce the quantity of waste and increase reuse,
material recycling and energy recovery as well as reducing the
quantity of waste consigned to landfill. Waste is usually classified
as either hazardous or non-hazardous. The total amount of haz-
ardous waste in 2015 was 27,824 tons, compared with 24,944
tons in 2014, an increase of close to 12%. Hazardous waste sent
to landfill amounted to 1,155 tons.
Water consumption continues to decrease, from 4,982,000 m3
in 2014 to 4,919,000 m3 in 2015. During the year an evaluation
was done of areas with the highest water-related risks. As a result
we are working with preventive and mitigating activities at our
facilities in for instance India.
Transport and logistics
Carbon emissions resulting from our internal freight transport and
deliveries to customers are more than double the CO2 emissions
from our production plants. This is therefore a prioritized area for
us with many different initiatives.
Carbon emissions for the total volume transported in our man-
ufacturing supply chain were calculated at 505,000 tons for 2014.
This is equivalent to reduced CO2 emissions of close to 3%. Data
for 2015 will be available in May 2016.
During 2015, we optimized rail transport in Sweden from Umeå
to Tuve by utilizing free space and enhancing on and offloading.
This resulted in an annual CO2 saving of approximately 100,000 kg.
This is equivalent to the CO2 emissions of 230 trucks transporting
the same freight by road.
The majority of the Volvo Group’s major transport suppliers are
certified in accordance with ISO 14001, or equivalent.
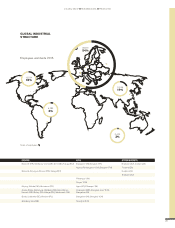
MAJ
O
R PR
O
DU
C
TI
O
N FA
C
ILITIES
NO
RTH AMERI
C
A S
O
UTH AMERI
C
A
VolvoTruck
s
N
ew River Valley
(
US
)
C
uritiba
(
BR
)
UD
T
ruc
k
s
R
enau
l
t
T
ruc
k
s
M
a
ck
T
ru
cks
M
acun
g
ie (US)
E
i
che
r
*
Dongfeng Trucks
*
En
g
ines and transmission
s
H
a
g
erstown
(
US
)
C
uritiba
(
BR
)
C
onstruction E
q
ui
p
ment Shippensburg
(
US
)
Pederneiras
(
BR
)
Bu
ses
St Claire, St Eustache, St Francois du lac (CA)
M
exico City
(
MX
)
, Plattsbur
g
h
(
US
)
C
uritiba
(
BR
)
V
o
l
vo
P
enta
L
exington
(
US
)
*
Ownership ≥ 45%
34