Volvo 2015 Annual Report Download - page 128
Download and view the complete annual report
Please find page 128 of the 2015 Volvo annual report below. You can navigate through the pages in the report by either clicking on the pages listed below, or by using the keyword search tool below to find specific information within the annual report.-
 1
1 -
2
-
3
-
4
-
5
-
6
-
7
-
8
-
9
-
10
-
11
-
12
-
13
-
14
-
15
-
16
-
17
-
18
-
19
-
20
-
21
-
22
-
23
-
24
-
25
-
26
-
27
-
28
-
29
-
30
-
31
-
32
-
33
-
34
-
35
-
36
-
37
-
38
-
39
-
40
-
41
-
42
-
43
-
44
-
45
-
46
-
47
-
48
-
49
-
50
-
51
-
52
-
53
-
54
-
55
-
56
-
57
-
58
-
59
-
60
-
61
-
62
-
63
-
64
-
65
-
66
-
67
-
68
-
69
-
70
-
71
-
72
-
73
-
74
-
75
-
76
-
77
-
78
-
79
-
80
-
81
-
82
-
83
-
84
-
85
-
86
-
87
-
88
-
89
-
90
-
91
-
92
-
93
-
94
-
95
-
96
-
97
-
98
-
99
-
100
-
101
-
102
-
103
-
104
-
105
-
106
-
107
-
108
-
109
-
110
-
111
-
112
-
113
-
114
-
115
-
116
-
117
-
 118
118 -
 119
119 -
 120
120 -
 121
121 -
 122
122 -
 123
123 -
 124
124 -
 125
125 -
 126
126 -
 127
127 -
 128
128 -
 129
129 -
 130
130 -
 131
131 -
 132
132 -
 133
133 -
 134
134 -
 135
135 -
 136
136 -
 137
137 -
 138
138 -
139
-
140
-
141
-
142
-
143
-
144
-
145
-
146
-
147
-
148
-
149
-
150
-
151
-
152
-
153
-
154
-
155
-
156
-
157
-
158
-
159
-
160
-
161
-
162
-
163
-
164
-
165
-
166
-
167
-
168
-
169
-
170
-
171
-
172
-
173
-
174
-
175
-
176
-
177
-
178
-
179
-
180
-
181
-
182
-
183
-
184
-
185
-
186
-
187
-
188
-
189
-
190
-
191
-
192
-
193
-
194
-
195
-
196
-
197
-
198
-
199
-
200
-
201
-
202
-
203
-
204
 |
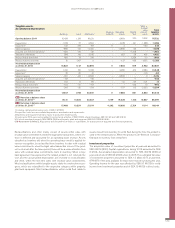
 |
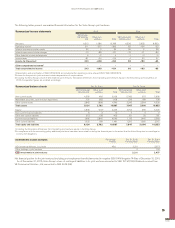
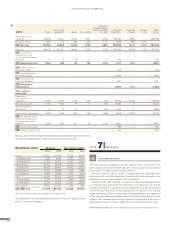
2014 Trucks Con struction
Equipment Buses Volvo Penta
Corporate
functions, Group
functions& Other
incl. elim. Industrial
Operations Customer
Finance Elimina-
tions Volvo
Group
Net sales, external
customers 188,079 52,641 18,159 7,541 6,906 273,327 9,623 – 282,948
Net sales, internal 2,825 215 486 249 –1,101 2,674 488 –3,162 –
I/S Net sales 190,904 52,855 18,645 7,790 5,805 275,999 10,111 –3,162 282,948
Expenses –186,777 –52,211 –18,544 –7,067 –7,333 –271,934 –8,399 3,162 –277,170
I/S Income from
investments in joint
ventures and associated
companies 31 7 –8 2 14 46 – – 46
I/S Operating income 4,157 652 92 724 –1,514 4,111 1,712 – 5,824
I/S Interest income
and similar credits 328 – – 328
I/S Interest expense
and similar charges –1, 994 – – –1, 994
I/S Other financial
income and expense 931 – – 931
I/S Income after
financial items 3,377 1,712 – 5,089
Other segment
information
Depreciation,
amortization and
impairment –10,499 –2,017 –343 –267 453 –12,673 –3,257 – –15,930
Restructuring costs –1,465 –582 –9 –5 –504 –2,564 –7 – –2,571
Gains/losses from
divestments 23 8 15 – 956 1,002 21 – 1,023
Investments in fixed assets 6,500 1,335 290 308 1,084 9,518 9,677 – 19,195
B/S Investments in joint
ventures and associated
companies (the equity
method) 2,583 250 220 30 1,739 4,821 – – 4,821
B/S Assets held for sale 288 – – 288
B/S Liabilities held for sale –130 – – –130
Internal sales between segments are generally made at standard cost of sales,
including calculated interest and product improvement expenses.
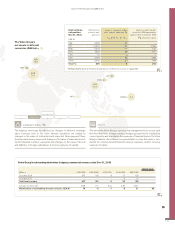
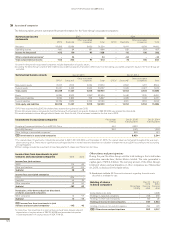
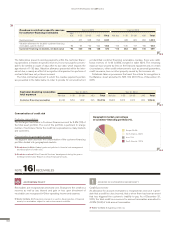
Reporting by market Net sales Non-current assets1
2015 2014 2015 2014
Europe 120,413 106,176 72,738 76,016
of which Sweden 9,142 8,042 22,998 25,452
of which France 23,114 20,733 18,195 19,885
North America 101,952 76,258 23,379 21,317
of which USA 84,035 60,810 20,562 18,034
South America 16,725 26,958 2,319 2,896
of which Brazil 8,608 19,260 1,909 2,434
Asia 53,470 52,076 23,155 22,198
of which China 8,574 12,374 2,460 2,678
of which Japan 15,119 14,382 15,041 13,876
Other markets 19,955 21,481 974 1,087
I/S B/S Total 312,515 282,948 122,565 123 ,515
1 Non-current assets include intangible and tangible assets.
The reporting of net sales by market is based on where the delivery of the
goods or services took place.
The Volvo Group’s recognized net sales pertain mainly to revenues from
sales of goods and services. Net sales are, if the occasion arises, reduced
by the value of rebates granted and by returns.
Revenue from the sale of goods is recognized when significant risks
and rewards of ownership have been transferred to external parties, nor-
mally when the goods are delivered to the customer.
However, if the sale of goods is combined with a buy-back agreement
or a residual value guarantee, the transaction is recognized as an operat-
ing lease transaction if significant risks in regard to the goods are retained
in Volvo Group. Revenue is then recognized over the period of the residual
value commitment. If the residual value risk commitment is not significant
or the sale was made to an independent party before Volvo Group is com-
mitted to the residual value risk the revenue is recognized at the time of
sale and a provision is made to reflect the estimated residual value risk.
Read more in Note 21 Other provisions, for a description of residual value risks.
ACCOUNTING POLICY
REVENUE
NOTE 7
126
GROUP PERFORMANCE 2015 NOTES