Volvo 2015 Annual Report Download - page 26
Download and view the complete annual report
Please find page 26 of the 2015 Volvo annual report below. You can navigate through the pages in the report by either clicking on the pages listed below, or by using the keyword search tool below to find specific information within the annual report.-
 1
1 -
2
-
3
-
4
-
5
-
6
-
7
-
8
-
9
-
10
-
11
-
12
-
13
-
14
-
15
-
 16
16 -
 17
17 -
 18
18 -
 19
19 -
 20
20 -
 21
21 -
 22
22 -
 23
23 -
 24
24 -
 25
25 -
 26
26 -
 27
27 -
 28
28 -
 29
29 -
 30
30 -
 31
31 -
 32
32 -
 33
33 -
 34
34 -
 35
35 -
 36
36 -
37
-
38
-
39
-
40
-
41
-
42
-
43
-
44
-
45
-
46
-
47
-
48
-
49
-
50
-
51
-
52
-
53
-
54
-
55
-
56
-
57
-
58
-
59
-
60
-
61
-
62
-
63
-
64
-
65
-
66
-
67
-
68
-
69
-
70
-
71
-
72
-
73
-
74
-
75
-
76
-
77
-
78
-
79
-
80
-
81
-
82
-
83
-
84
-
85
-
86
-
87
-
88
-
89
-
90
-
91
-
92
-
93
-
94
-
95
-
96
-
97
-
98
-
99
-
100
-
101
-
102
-
103
-
104
-
105
-
106
-
107
-
108
-
109
-
110
-
111
-
112
-
113
-
114
-
115
-
116
-
117
-
118
-
119
-
120
-
121
-
122
-
123
-
124
-
125
-
126
-
127
-
128
-
129
-
130
-
131
-
132
-
133
-
134
-
135
-
136
-
137
-
138
-
139
-
140
-
141
-
142
-
143
-
144
-
145
-
146
-
147
-
148
-
149
-
150
-
151
-
152
-
153
-
154
-
155
-
156
-
157
-
158
-
159
-
160
-
161
-
162
-
163
-
164
-
165
-
166
-
167
-
168
-
169
-
170
-
171
-
172
-
173
-
174
-
175
-
176
-
177
-
178
-
179
-
180
-
181
-
182
-
183
-
184
-
185
-
186
-
187
-
188
-
189
-
190
-
191
-
192
-
193
-
194
-
195
-
196
-
197
-
198
-
199
-
200
-
201
-
202
-
203
-
204
 |
 |
READ MORE The Volvo Group creates
shared economic, environmental and social
value with stakeholders across our value
chain, as described on page 64.
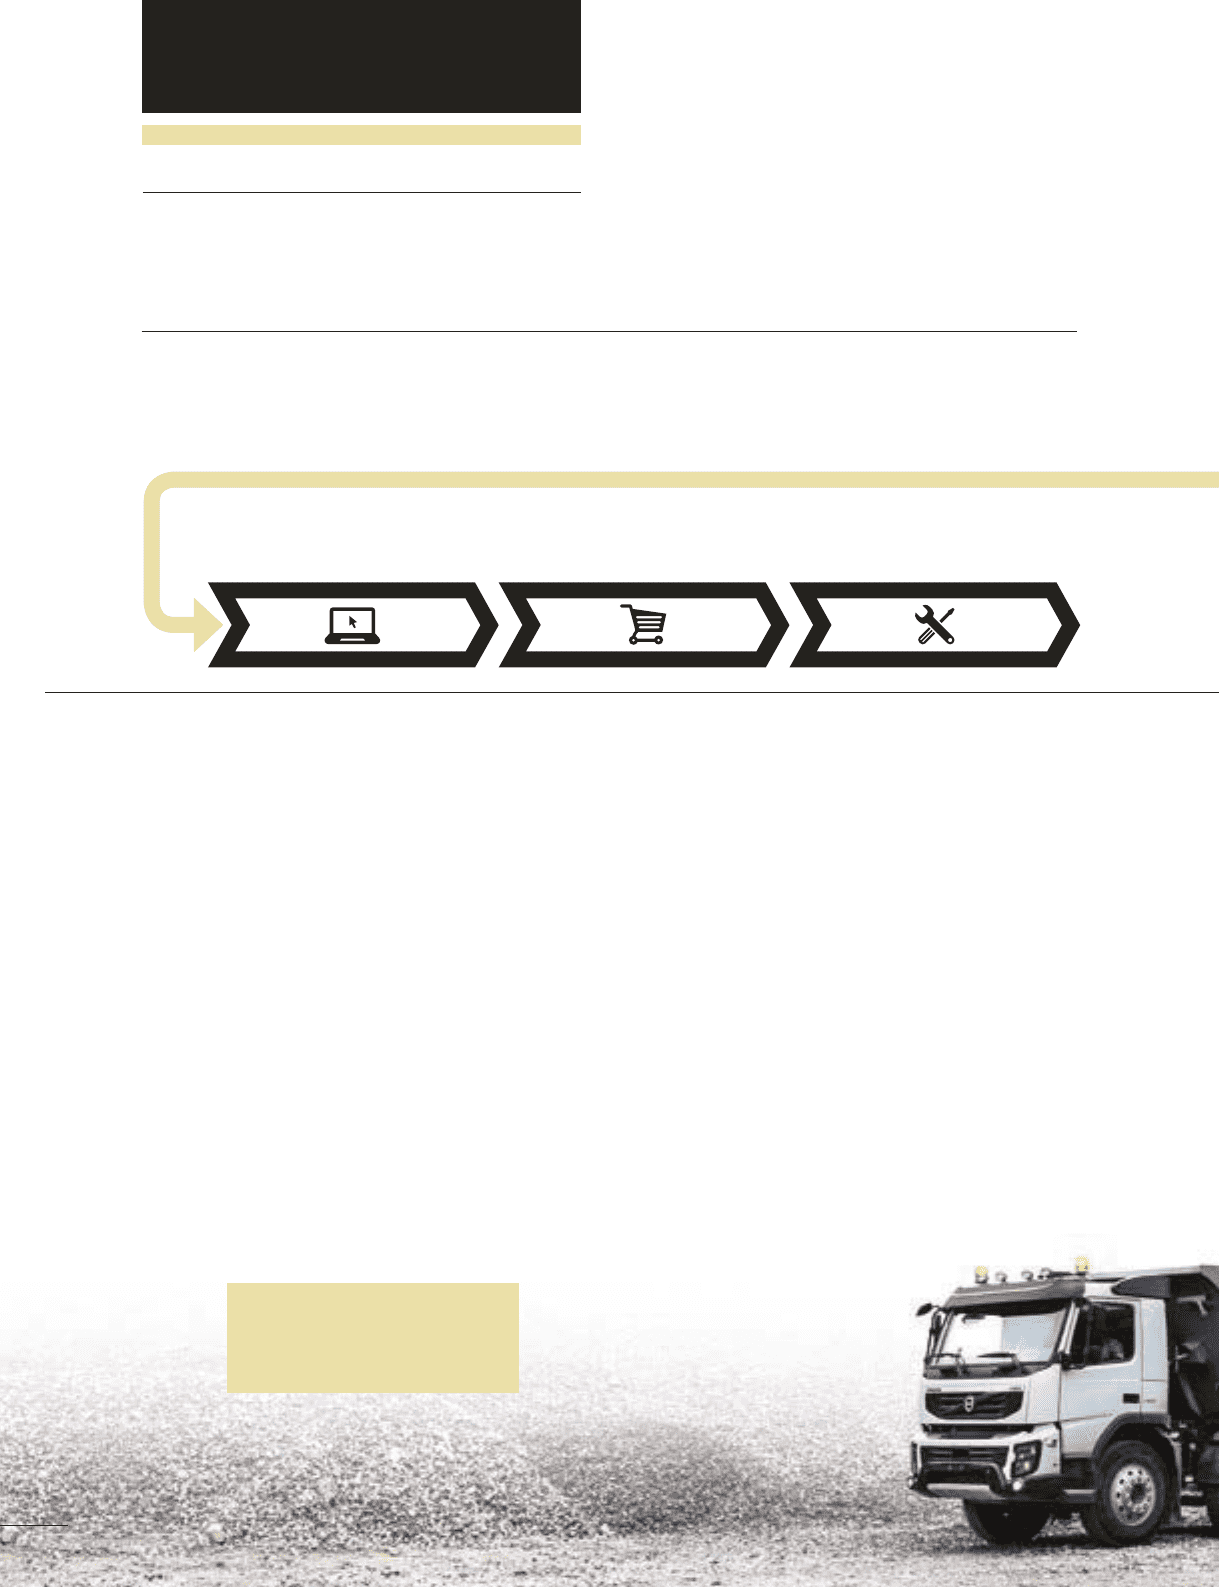
A GLOBAL GROUP
BUSINESS MODEL
VALUE CHAIN
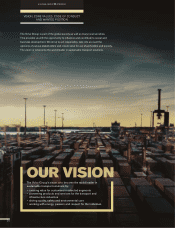
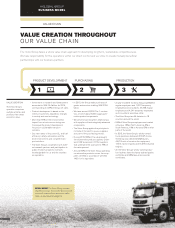
The Volvo Group takes a whole value chain approach to developing long-term, sustainable competitiveness.
We take responsibility for the operations within our direct control and we strive to create mutually beneficial
partnerships with our business partners.
PRODUCT DEVELOPMENT
VALUE CREATION
The Volvo Group’s
operation comprises
multiple activities and
products that create
economic value.
PURCHASING PRODUCTION
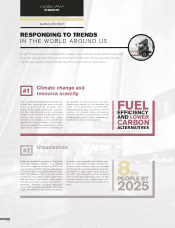
• Investments in research and development
amounted to SEK 15.4 billion for 2015,
corresponding to 4.9% of Group net sales.
• Product development is based on the
needs of customers, legislation, changes
in society and new technology.
• More than 90% of the environmental
impact from a truck occurs during use.
Consequently, product development
focuses on sustainable transport
solutions.
• Our main areas of focus are CO2 and fuel
efficiency; safety, automation and the
driver environment; and complete trans-
port solutions.
• The Volvo Group’s cooperation with exter-
nal research partners and participation in
public research programs increases
knowledge both for us and the societies
we operate in.
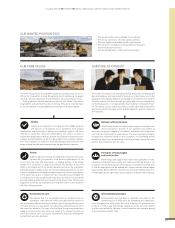
• In 2015, the Group made purchases of
goods and services totalling SEK 210.6
billion.
• We have around 43,000 Tier 1 contrac-
tors, of which about 6,500 supply auto-
motive product components.
• We strive to have long-term relationships
with suppliers of technologically advanced
components.
• The Volvo Group applies the principles in
its Code of Conduct to assess suppliers
as a part of the purchasing process.
• During 2015, 86% of the value bought
from automotive product suppliers under-
went CSR assessment. Of the suppliers
that underwent the assessment 79% of
the value passed.
• Around 95% of the Volvo Group spending
on automotive products comes from sup-
pliers certified in accordance with ISO
14001 or its equivalent.
• At year-end 2015 the Volvo Group had 88,464
regular employees and 11,037 temporary
employees and consultants. 47,368 regular
employees and 4,341 temporary employees
and consultants were blue collar.
• The Volvo Group has 66 factories in 18
countries around the world.
• 54% of Volvo Group employees are located
in Europe, 18% in North America, 6% in
South America, 19% in Asia and 3% in other
parts of the world.
• In 2015, the Volvo Group's wholly-owned
truck operations delivered 207,475 trucks.
The Group also delivered 8,825 buses,
44,718 units of construction equipment,
17,413 marine engines and 15,295 industrial
engines.
• All the Volvo Group’s wholly-owned produc-
tion facilities have third-party audited quality
certificate and 98% have environmental
certificates.
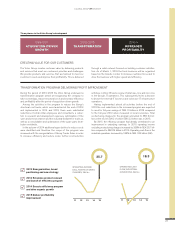
VALUE CREATION THROUGHOUT
OUR VALUE CHAIN
123
24