Volvo 2015 Annual Report Download - page 126
Download and view the complete annual report
Please find page 126 of the 2015 Volvo annual report below. You can navigate through the pages in the report by either clicking on the pages listed below, or by using the keyword search tool below to find specific information within the annual report.-
 1
1 -
2
-
3
-
4
-
5
-
6
-
7
-
8
-
9
-
10
-
11
-
12
-
13
-
14
-
15
-
16
-
17
-
18
-
19
-
20
-
21
-
22
-
23
-
24
-
25
-
26
-
27
-
28
-
29
-
30
-
31
-
32
-
33
-
34
-
35
-
36
-
37
-
38
-
39
-
40
-
41
-
42
-
43
-
44
-
45
-
46
-
47
-
48
-
49
-
50
-
51
-
52
-
53
-
54
-
55
-
56
-
57
-
58
-
59
-
60
-
61
-
62
-
63
-
64
-
65
-
66
-
67
-
68
-
69
-
70
-
71
-
72
-
73
-
74
-
75
-
76
-
77
-
78
-
79
-
80
-
81
-
82
-
83
-
84
-
85
-
86
-
87
-
88
-
89
-
90
-
91
-
92
-
93
-
94
-
95
-
96
-
97
-
98
-
99
-
100
-
101
-
102
-
103
-
104
-
105
-
106
-
107
-
108
-
109
-
110
-
111
-
112
-
113
-
114
-
115
-
 116
116 -
 117
117 -
 118
118 -
 119
119 -
 120
120 -
 121
121 -
 122
122 -
 123
123 -
 124
124 -
 125
125 -
 126
126 -
 127
127 -
 128
128 -
 129
129 -
 130
130 -
 131
131 -
 132
132 -
 133
133 -
 134
134 -
 135
135 -
 136
136 -
137
-
138
-
139
-
140
-
141
-
142
-
143
-
144
-
145
-
146
-
147
-
148
-
149
-
150
-
151
-
152
-
153
-
154
-
155
-
156
-
157
-
158
-
159
-
160
-
161
-
162
-
163
-
164
-
165
-
166
-
167
-
168
-
169
-
170
-
171
-
172
-
173
-
174
-
175
-
176
-
177
-
178
-
179
-
180
-
181
-
182
-
183
-
184
-
185
-
186
-
187
-
188
-
189
-
190
-
191
-
192
-
193
-
194
-
195
-
196
-
197
-
198
-
199
-
200
-
201
-
202
-
203
-
204
 |
 |
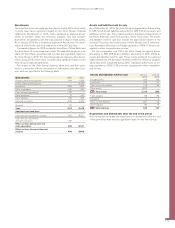
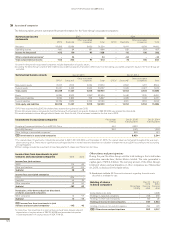
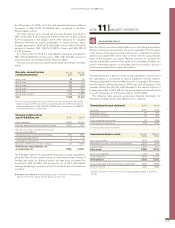
Other shares and participations
During the year the Volvo Group sold the total holding in the listed Indian
automotive manufacturer, Eicher Motors limited. The sale generated a
capital gain of SEK 4.6 billion. The carrying amount of the Volvo Group’s
holding of shares and participations in other companies as of December
31, 2015, is disclosed in the table below.
Read more in Note 30 Financial Instruments regarding financial assets
classified as available for sale.
Holding of shares
in listed companies Percentage
holding
Dec 31,
2015
Carrying
value
Dec 31,
2014
Carrying
value
Eicher Motors Ltd., India – – 4,228
Holdings in Japanese companies – 348 290
Holdings in other listed companies – 160 25
Holding of shares in listed companies 507 4,543
Holding of shares in non-listed companies 394 474
B/S Other shares and participations 902 5,017
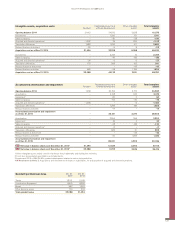
Income/loss from investments in joint
ventures and associated companies 2015 2014
Income/loss joint ventures
VECV 115 45
Other joint ventures –87 –64
Subtotal 28 –19
Income/loss associated companies
DFCV –276 –
Deutz AG 45 32
Other companies 48 50
Subtotal –183 82
Revaluation, write-down and gain on divestment
of shares associated companies
Other companies 12 –17
Subtotal 12 –17
I/S Income/loss from investments in joint
ventures and associated companies
1–143 46
1 Income/loss from investments in joint ventures include Volvo Group’s share of
depreciation of surplus values of SEK 35 M (29) and associated companies
include depreciation of surplus values of SEK 71 M (9).
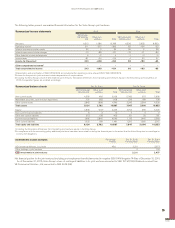
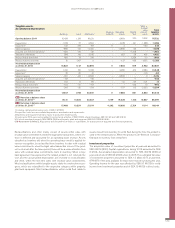
The following tables present summarized financial information for the Volvo Group’s associated companies:
Summarized income
statements
2015 2014
DFCV Deutz AG Other associated
companies Total DFCV Deutz AG Other associated
companies Total
Net sales 33,606 12,089 5,630 51,324 – 10,411 4,038 14,450
Operating income –930 84 181 –664 – 220 207 427
Income for the period1–613 179 97 –338 – 110 156 266
Other comprehensive income2– 24 – 24 ––34 ––34
Total comprehensive income –613 203 97 –313 – 76 156 232
1 Income for the period in associated companies include depreciation of surplus values.
2 Including the Volvo Group’s share of OCI related to associated companies. Translation differences from translating associated companies’ equity in the Volvo Group are
excluded.
Summarized balance sheets Dec 31, 2015 Dec 31, 2014
DFCV1Deutz AG2Other associated
companies Total DFCV1Deutz AG2Other associated
companies Total
Non-current assets 18,107 7,002 2,264 27,373 – 6,847 1,707 8,554
Current assets 20,131 4,435 4,960 29,527 – 5,305 2,027 7,332
Total assets 38,238 11,437 7,225 56,900 – 12,152 3,734 15,886
Equity 15,265 5,902 2,767323,934 – 5,446 1,035 6,481
Non-current liabilities 2,264 2,865 738 5,867 – 3,325 1,146 4,471
Current liabilities 20,709 2,670 3,720 27,099 – 3,381 1,553 4,934
Total equity and liabilities 38,238 11,437 7,225 56,900 – 12,152 3,734 15,886
1 DFCV was acquired during 2015. No dividend was received during financial year 2015.
2 Deutz AG’s equity share is recognized in the Volvo Group with a time lag of one quarter. Dividends of SEK 20 M (0) was received from Deutz AG.
3 Financial statements of Inner Mongolia North Hauler Jont Stock Co, Ltd., China has been included for the first time in 2015.
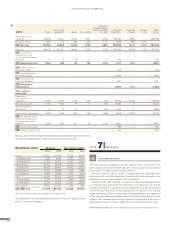
Investments in associated companies Percentage
holding Dec31, 2015
Carrying value Dec 31, 2014
Carrying value
Dongfeng Commercial Vehicles Co., Ltd (DFCV) China 45.0 6,581 –
Deutz AG, Germany
125.0 1,475 1,393
Other holdings in associated companies
2883 951
B/S Investments in associated companies 8,939 2,344
1 The market value of investments in Deutz AG amounted to SEK 1,021 M (1,236) as of December 31, 2015. The market value has fluctuated throughout the year, even
above carrying value. There was no significant or prolonged decline in market value and therefore no indication of impairment during 2015 according to the accounting
principle applied.
2 Other holdings include the investment of Inner Mongolia North Hauler Jont Stock Co, Ltd., China.
Associated companies
124
GROUP PERFORMANCE 2015 NOTES