Volvo 2015 Annual Report Download - page 198
Download and view the complete annual report
Please find page 198 of the 2015 Volvo annual report below. You can navigate through the pages in the report by either clicking on the pages listed below, or by using the keyword search tool below to find specific information within the annual report.-
 1
1 -
2
-
3
-
4
-
5
-
6
-
7
-
8
-
9
-
10
-
11
-
12
-
13
-
14
-
15
-
16
-
17
-
18
-
19
-
20
-
21
-
22
-
23
-
24
-
25
-
26
-
27
-
28
-
29
-
30
-
31
-
32
-
33
-
34
-
35
-
36
-
37
-
38
-
39
-
40
-
41
-
42
-
43
-
44
-
45
-
46
-
47
-
48
-
49
-
50
-
51
-
52
-
53
-
54
-
55
-
56
-
57
-
58
-
59
-
60
-
61
-
62
-
63
-
64
-
65
-
66
-
67
-
68
-
69
-
70
-
71
-
72
-
73
-
74
-
75
-
76
-
77
-
78
-
79
-
80
-
81
-
82
-
83
-
84
-
85
-
86
-
87
-
88
-
89
-
90
-
91
-
92
-
93
-
94
-
95
-
96
-
97
-
98
-
99
-
100
-
101
-
102
-
103
-
104
-
105
-
106
-
107
-
108
-
109
-
110
-
111
-
112
-
113
-
114
-
115
-
116
-
117
-
118
-
119
-
120
-
121
-
122
-
123
-
124
-
125
-
126
-
127
-
128
-
129
-
130
-
131
-
132
-
133
-
134
-
135
-
136
-
137
-
138
-
139
-
140
-
141
-
142
-
143
-
144
-
145
-
146
-
147
-
148
-
149
-
150
-
151
-
152
-
153
-
154
-
155
-
156
-
157
-
158
-
159
-
160
-
161
-
162
-
163
-
164
-
165
-
166
-
167
-
168
-
169
-
170
-
171
-
172
-
173
-
174
-
175
-
176
-
177
-
178
-
179
-
180
-
181
-
182
-
183
-
184
-
185
-
186
-
187
-
 188
188 -
 189
189 -
 190
190 -
 191
191 -
 192
192 -
 193
193 -
 194
194 -
 195
195 -
 196
196 -
 197
197 -
 198
198 -
 199
199 -
 200
200 -
 201
201 -
 202
202 -
 203
203 -
 204
204
 |
 |
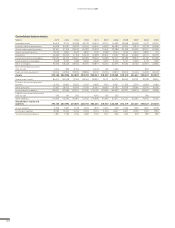
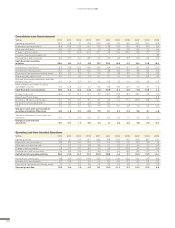
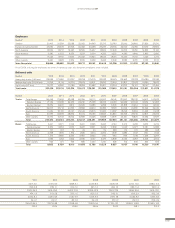
Volvo share statistics
Data per share
(adjusted for issues and splits)12015 2014 2013 2012 2011 2010 2009 2008 2007 2006 2005
Basic earnings, SEK17.42 1.03 1.77 5.44 8.75 5.36 –7.26 4.90 7.37 8.03 6.44
Cash dividend, SEK 3.0093.00 3.00 3.00 3.00 2.50 0 2.00 5.50 10.0083.35
Share price at year-end (B share), SEK 79.10 84.70 84.45 88.80 75.30 118.50 61.45 42.90 108.50 90.70 74.90
Direct return (B share), %23.8 3.5 3.6 3.4 4.0 2.1 – 4.7 5.1 11.0 4.5
Effective return (B share), %3–3 4 –2 22 –34 97 43 –59 25.7 39.8 48.5
Price/earnings ratio (B share)410.7 82.2 47.7 16.3 8.6 22.1 neg 8.8 14.7 11.3 11.6
EBIT multiple57.7 26.3 19.6 9.0 5 .1 12.0 neg 3.6 9.7 10.3 9.3
Payout ratio, %640 291 169 55 34 47 – 41 75 62 52
Shareholders’ equity, SEK741 39 38 43 42 36 33 41 41 43 38 .80
Return on shareholders' equity, % 18.4 2.8 5.0 12.9 23.1 16.0 neg 12.1 18.1 19.6 17.8
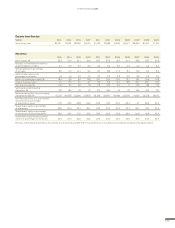
Other share data
2015 2014 2013 2012 2011 2010 2009 2008 2007 2006 2005
Number of shareholders at year-end 234,989 237,871 246,265 242,482 251,715 240,043 233,311 220,192 197,519 183,735 195,442
Number of Series A shares
outstanding at year-end, million 485 492 499 526 643 657 657 657 657 131.4 131.4
Number of Series B shares
outstanding at year-end, million 1,546 1,537 1,530 1,502 1,385 1,371 1,371 1,371 1,369 273.4 273.1
Average number of shares
outstanding, million 2,030 2,028 2,028 2,028 2,027 2,027 2,027 2,027 2,025 404.7 405.2
Number of Series A shares traded in
Stockholm during the year, million 51.7 86.3 53.0 45.4 130.5 203.2 147.0 308.0 172.3 56.4 39.3
Number of Series B shares traded
in Stockholm during the year, million 2,052.1 2,068.7 1,878.5 2,081.2 2,944.1 2,272.4 2,713.9 3,130.0 2,712.4 617.0 518.7
1 Basic earnings per share is calculated as income for the period divided
by average number of shares outstanding.
2 Proposed dividend in SEK per share divided by share price at year-end.
3 Share price at year-end, including proposed dividend during the year,
divided by share price at beginning of the year, (2006 includes a share split
6:1 in which the sixth share was redeemed by AB Volvo for an amount of
SEK 5.00 per share).
4 Share price at year-end divided by basic earnings per share.
5 Market value at year-end minus net financial position and minority interests
divided by operating income.
6 Cash dividend divided by basic earnings per share.
7 Shareholders’ equity for shareholders in AB Volvo divided by number
of shares outstanding at year-end.
8 Including extra payment of SEK 5 through redemption of shares.
9 Proposed by the Board of Directors.
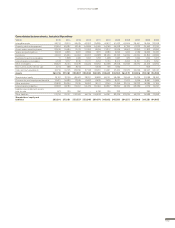
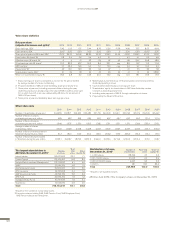
The largest shareholders in
AB Volvo, December 31, 20151Number
of shares
% of
total
votes Share
capital, %
Industrivärden 143,671,662 22.3 7.1
Cevian Capital 170,515,457 14.8 8.4
Norges Bank Investment Management 112,719,593 6.1 5.6
SHB 2 37,559,739 5.8 1.9
Alecta (pension funds) 79,960,000 4.5 3.9
AFA Insurance 24,737,368 3.4 1.2
AMF Insurance & Funds 49,292,749 2.6 2.4
AP4 Fund 24,554,732 1.9 1.2
Swedbank Robur Funds 90,191,649 1.8 4.4
Skandia Liv 10,540,070 0.9 0.5
Total 743,743,019 64.1 36.6
Distribution of shares,
December 31, 20151Number of
shareholders % of total
votes1Share of
capital, %1
1–1,000 shares 178,756 2.7 2.6
1,001–10,000 shares 51,005 6.0 6.9
10,001–100,000 shares 4,447 3.5 5.2
100,001– 781 87.7 85.3
Total 234,989 100.0 100.0
1 Based on the number of outstanding shares.
2 Comprises shares held by SHB, SHB Pension Fund, SHB Employee Fund,
SHB Pensionskassa and Oktogonen.
1 Based on all registered shares.
AB Volvo held 4.6% of the Company’s shares on December 31, 2015.
OTHER INFORMATION
196