Volvo 2015 Annual Report Download - page 119
Download and view the complete annual report
Please find page 119 of the 2015 Volvo annual report below. You can navigate through the pages in the report by either clicking on the pages listed below, or by using the keyword search tool below to find specific information within the annual report.-
 1
1 -
2
-
3
-
4
-
5
-
6
-
7
-
8
-
9
-
10
-
11
-
12
-
13
-
14
-
15
-
16
-
17
-
18
-
19
-
20
-
21
-
22
-
23
-
24
-
25
-
26
-
27
-
28
-
29
-
30
-
31
-
32
-
33
-
34
-
35
-
36
-
37
-
38
-
39
-
40
-
41
-
42
-
43
-
44
-
45
-
46
-
47
-
48
-
49
-
50
-
51
-
52
-
53
-
54
-
55
-
56
-
57
-
58
-
59
-
60
-
61
-
62
-
63
-
64
-
65
-
66
-
67
-
68
-
69
-
70
-
71
-
72
-
73
-
74
-
75
-
76
-
77
-
78
-
79
-
80
-
81
-
82
-
83
-
84
-
85
-
86
-
87
-
88
-
89
-
90
-
91
-
92
-
93
-
94
-
95
-
96
-
97
-
98
-
99
-
100
-
101
-
102
-
103
-
104
-
105
-
106
-
107
-
108
-
 109
109 -
 110
110 -
 111
111 -
 112
112 -
 113
113 -
 114
114 -
 115
115 -
 116
116 -
 117
117 -
 118
118 -
 119
119 -
 120
120 -
 121
121 -
 122
122 -
 123
123 -
 124
124 -
 125
125 -
 126
126 -
 127
127 -
 128
128 -
 129
129 -
130
-
131
-
132
-
133
-
134
-
135
-
136
-
137
-
138
-
139
-
140
-
141
-
142
-
143
-
144
-
145
-
146
-
147
-
148
-
149
-
150
-
151
-
152
-
153
-
154
-
155
-
156
-
157
-
158
-
159
-
160
-
161
-
162
-
163
-
164
-
165
-
166
-
167
-
168
-
169
-
170
-
171
-
172
-
173
-
174
-
175
-
176
-
177
-
178
-
179
-
180
-
181
-
182
-
183
-
184
-
185
-
186
-
187
-
188
-
189
-
190
-
191
-
192
-
193
-
194
-
195
-
196
-
197
-
198
-
199
-
200
-
201
-
202
-
203
-
204
 |
 |

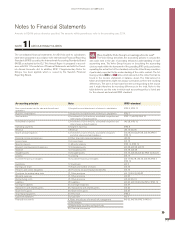
GROUP PERFORMANCE 2015 NOTES
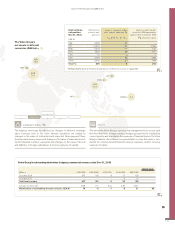
SEK
15.6
GBP 3.0
CNY
11. 4
INR 1.1
EUR
21.1
KRW 3.0
OTHER 11.0
INTEREST-RATE RISKS VALUTARISK ER CREDIT RISKS
FINANCIAL RISKS
OTHER PRICE RISKSLIQUIDITY RISKS
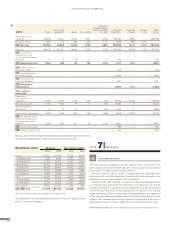
The Volvo Group’s
net assets in different
currencies (SEK bn) =
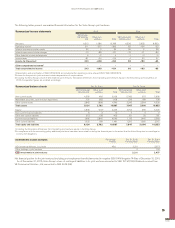
Market value
Millions USD/SEK USD/KRW USD/CNY AUD/SEK GBP/SEK
Due date 2016 477 124 9 17 126
Due date 2017 – – – 9 10
Total local currency 477 124 9 25 136
Average contract rate 8.48 1.17 6.41 5.84 12.57
Market value of outstanding forward contracts, SEK M 74 –6 –1 –3 31 95
Volvo Group’s outstanding derivatives hedging commercial currency risks Dec 31, 2015
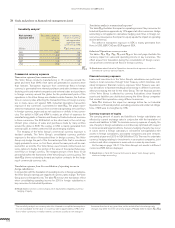
CURRENCY RISKS B
The balance sheet may be affected by changes in different exchange
rates. Currency risks in the Volvo Group’s operations are related to
changes in the value of contracted and expected future payment flows
(commercial currency exposure), changes in the value of loans and invest-
ments (financial currency exposure) and changes in the value of assets
and liabilities in foreign subsidiaries (currency exposure of equity).
4:2
POLICY
The aim of the Volvo Group’s currency risk management is to secure cash
flow from firm flows through currency hedges pursuant to the established
currency policy, and to minimize the exposure of financial items in the Volvo
Group’s balance sheet. Below is a presentation on how this work is con-
ducted for commercial and financial currency exposure, and for currency
exposure of equity.
INTEREST-RATE RISKS CURRENCY RISKS CREDIT RISKS
FINANCIAL RISKS
OTHER PRICE RISKSLIQUIDITY RISKS
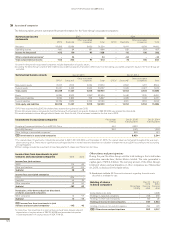
4:1
Risk net finan-
c i a l p o s i t i o n
Dec 31, 2015
SEK M
Net financial
position excl.
pensions
Impact onearnings before
tax if interest rate rises 1%
A (Interest-rate risks)
Impact on Net financial
position if SEK appreciates
against other currencies 10%
B
(Currency risks)
SEK 2,485 22 –
JPY –14,935 –131 1,494
RUB –1,303 –11 130
EUR 7,907 69 –791
CNY –41 0 4
USD 9,676 85 –968
Other –3,440 –30 344
Total C 349 3 214
Read more about the Industrial Operations net financial position on page 83.
JPY 2.9
117