Volvo 2015 Annual Report Download - page 103
Download and view the complete annual report
Please find page 103 of the 2015 Volvo annual report below. You can navigate through the pages in the report by either clicking on the pages listed below, or by using the keyword search tool below to find specific information within the annual report.-
 1
1 -
2
-
3
-
4
-
5
-
6
-
7
-
8
-
9
-
10
-
11
-
12
-
13
-
14
-
15
-
16
-
17
-
18
-
19
-
20
-
21
-
22
-
23
-
24
-
25
-
26
-
27
-
28
-
29
-
30
-
31
-
32
-
33
-
34
-
35
-
36
-
37
-
38
-
39
-
40
-
41
-
42
-
43
-
44
-
45
-
46
-
47
-
48
-
49
-
50
-
51
-
52
-
53
-
54
-
55
-
56
-
57
-
58
-
59
-
60
-
61
-
62
-
63
-
64
-
65
-
66
-
67
-
68
-
69
-
70
-
71
-
72
-
73
-
74
-
75
-
76
-
77
-
78
-
79
-
80
-
81
-
82
-
83
-
84
-
85
-
86
-
87
-
88
-
89
-
90
-
91
-
92
-
 93
93 -
 94
94 -
 95
95 -
 96
96 -
 97
97 -
 98
98 -
 99
99 -
 100
100 -
 101
101 -
 102
102 -
 103
103 -
 104
104 -
 105
105 -
 106
106 -
 107
107 -
 108
108 -
 109
109 -
 110
110 -
 111
111 -
 112
112 -
 113
113 -
114
-
115
-
116
-
117
-
118
-
119
-
120
-
121
-
122
-
123
-
124
-
125
-
126
-
127
-
128
-
129
-
130
-
131
-
132
-
133
-
134
-
135
-
136
-
137
-
138
-
139
-
140
-
141
-
142
-
143
-
144
-
145
-
146
-
147
-
148
-
149
-
150
-
151
-
152
-
153
-
154
-
155
-
156
-
157
-
158
-
159
-
160
-
161
-
162
-
163
-
164
-
165
-
166
-
167
-
168
-
169
-
170
-
171
-
172
-
173
-
174
-
175
-
176
-
177
-
178
-
179
-
180
-
181
-
182
-
183
-
184
-
185
-
186
-
187
-
188
-
189
-
190
-
191
-
192
-
193
-
194
-
195
-
196
-
197
-
198
-
199
-
200
-
201
-
202
-
203
-
204
 |
 |

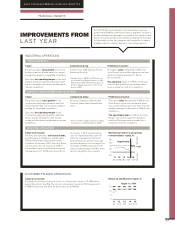
IMPROVEMENTS FROM
LAST YEAR
INDUSTRIAL OPERATIONS
CONSTRUCTION EQUIPMENT AND VOLVO PENTA
Target Comparison group Preliminary outcome*
The annual organic sales growth for the
construction equipment operations and Volvo
Penta, shall be equal to or exceed a weighted-
average for comparable competitors.
Each year, the operating margin for the
construction equipment operations and Volvo
Penta, shall be ranked among the top two
companies when benchmarked against relevant
competitors.
Brunswick, Caterpillar, CNH Industrial,
Cummins, Deere, Hitachi, Komatsu and
Terex.*
* Deere’s and Terex’s figures are based on rolling
four quarters as of the third quarter of 2015.
The organic sales decreased by 11.8% for the
Volvo Group’s construction equipment opera-
tions and Volvo Penta which was more than the
weighted average of a decrease of 3.8% for the
competitors.
The operating margin of 4.4% for the Volvo
Group’s construction equipment operations
and Volvo Penta was ranked number five in
comparison with the competitors.
Target Comparison group Preliminary outcome*
The annual organic sales growth for the truck
and bus operations shall be equal to or exceed
a weighted-average for comparable competitors.
Each year, the operating margin for the truck
and bus operations shall be ranked among the
top two companies when benchmarked against
relevant competitors.
Daimler, Iveco, MAN, Navistar, Paccar,
Scania and Sinotruk.*
* Daimler’s, Iveco’s, MAN’s and Navistar’s fig-
ures are based on rolling four quarters as of the
third quarter of 2015 and Sinotruk’s figures are
based on rolling four quarters as of the second
quarter of 2015.
The organic sales increased by 3.4% for the
Volvo Group’s truck and bus operations and was
above the weighted average of 1.7% for
the competitors.
The operating margin of 7.7% for the Group’s
truck and bus operations was ranked number
three in comparison with the competitors.
TRUCKS AND BUSES
29.0
13
–0.5
15
14.2
14
0
–
20
25.2
11
29.3
12
40
20
80
60
Net cash Net debt
Target below:
35%
40%
Net financial debt as a percentage
of shareholders’ equity, %
Target and outcome
The Industrial Operations’ net financial debt,
excluding pension obligations, shall be below
35% of shareholders’ equity under normal
conditions. At the end of 2015, the Volvo Group
had a financial net cash position of 0.5% of
shareholders’ equity compared with a financial
net debt position of 14.2% at the end of 2014.
INDUSTRIAL OPERATIONS
On January 1, 2013, new accounting
rules for employee benefits came into
effect. As a consequence, AB Volvo’s
Board of Directors decided to exclude
pension obligations from the target. The
new target of 35% corresponds to the
previous financial target of 40% in which
pension obligations were included.
Since 2012 the financial targets for the Volvo Group comprises
growth and profitability of the Group’s various operations measured
and benchmarked annually against competitors. This creates a clear
picture of how the operations are developing compared to the indus-
try. Information on how the comparison with competitors is made is
available under the heading Investors on www.volvogroup.com.
GROUP PERFORMANCE BOARD OF DIRECTORS’ REPORT 2015
FINANCIAL TARGETS
12.1
13
13.4
15
12.5
14
0
7.3
11
12.5
12
15
10
5
Target: 12−15%
Return on shareholders’ equity, %
CUSTOMER FINANCE OPERATIONS
Target and outcome
The target for Customer Finance is a return on shareholders’ equity of 12–15% and an
equity ratio not less than 8%. The return on shareholders’ equity for 2015 amounted to
13.4% (12.5). At year end 2015 the equity ratio was 8.0% (8.0).
101