Volvo 2015 Annual Report Download - page 84
Download and view the complete annual report
Please find page 84 of the 2015 Volvo annual report below. You can navigate through the pages in the report by either clicking on the pages listed below, or by using the keyword search tool below to find specific information within the annual report.-
 1
1 -
2
-
3
-
4
-
5
-
6
-
7
-
8
-
9
-
10
-
11
-
12
-
13
-
14
-
15
-
16
-
17
-
18
-
19
-
20
-
21
-
22
-
23
-
24
-
25
-
26
-
27
-
28
-
29
-
30
-
31
-
32
-
33
-
34
-
35
-
36
-
37
-
38
-
39
-
40
-
41
-
42
-
43
-
44
-
45
-
46
-
47
-
48
-
49
-
50
-
51
-
52
-
53
-
54
-
55
-
56
-
57
-
58
-
59
-
60
-
61
-
62
-
63
-
64
-
65
-
66
-
67
-
68
-
69
-
70
-
71
-
72
-
73
-
 74
74 -
 75
75 -
 76
76 -
 77
77 -
 78
78 -
 79
79 -
 80
80 -
 81
81 -
 82
82 -
 83
83 -
 84
84 -
 85
85 -
 86
86 -
 87
87 -
 88
88 -
 89
89 -
 90
90 -
 91
91 -
 92
92 -
 93
93 -
 94
94 -
95
-
96
-
97
-
98
-
99
-
100
-
101
-
102
-
103
-
104
-
105
-
106
-
107
-
108
-
109
-
110
-
111
-
112
-
113
-
114
-
115
-
116
-
117
-
118
-
119
-
120
-
121
-
122
-
123
-
124
-
125
-
126
-
127
-
128
-
129
-
130
-
131
-
132
-
133
-
134
-
135
-
136
-
137
-
138
-
139
-
140
-
141
-
142
-
143
-
144
-
145
-
146
-
147
-
148
-
149
-
150
-
151
-
152
-
153
-
154
-
155
-
156
-
157
-
158
-
159
-
160
-
161
-
162
-
163
-
164
-
165
-
166
-
167
-
168
-
169
-
170
-
171
-
172
-
173
-
174
-
175
-
176
-
177
-
178
-
179
-
180
-
181
-
182
-
183
-
184
-
185
-
186
-
187
-
188
-
189
-
190
-
191
-
192
-
193
-
194
-
195
-
196
-
197
-
198
-
199
-
200
-
201
-
202
-
203
-
204
 |
 |

GROUP PERFORMANCE BOARD OF DIRECTORS’ REPORT 2015 FINANCIAL PERFORMANCE
enough to offset the currency headwind leading to a net cost
increase of SEK 0.7 billion. The operating income was also posi-
tively impacted by the sale of the shares in Eicher Motors Limited
with approximately SEK 4.6 billion and the comparable figures
includes the provision for EU-litigation of SEK 3.8 billion. Credit
provision in Volvo CE in China of SEK 0.7 billion (0.7) was recog-
nized during the year. Additionally positive outcome of an arbitra-
tion case and gain on sale of properties had a positive impact of
approximately SEK 1 billion in the current year, in line with last
year’s capital gain on properties. Operating income also included
SEK 2.3 billion (2.6) related to restructuring costs.
Net financial items
Compared to previous year, net interest expense increased due to
higher interest rates on outstanding debt.
Net interest expense for the Volvo Group amounted to SEK 2.1
billion (1.7).
Other financial income and expense were negatively impacted
in an amount of SEK 0.5 billion from realized result and unrealized
revaluation of derivatives related to hedging, compared to a posi-
tive impact of SEK 1.1 billion in the previous year.
Read more in Note 9 Other financial income and expenses.
Income taxes
The tax expense for the year amounted to SEK 5.3 billion (2.9)
corresponding to a tax rate of 26% (56). The tax rate was
impacted by both the non-taxable capital gain from the divest-
ment of shares in Eicher Motors Limited of SEK 4.6 billion which
was offset by the revaluation of deferred tax assets in Japan of
SEK –1.1 billion. The tax rate in 2014 was impacted by the non-
deductible provision for EU antitrust litigation.
Income for the period and earnings per share
The income for the period amounted to SEK 15,099 M (2,235),
corresponding to diluted earnings per share of SEK 7.41 (1.03).
The return on shareholders’ equity was 18.4% (2.8%).
Impact of exchange rates on operating income
Operating income for 2015 in Industrial Operations was positively
impacted by approximately SEK 5.1 billion mainly as a consequence
of the depreciation of the SEK against most of the key Volvo Group
currencies. The currency impact was primarily related to the net
flows in foreign currency.
Key operating ratios, %
Industrial Operations 2015 2014
Gross margin 22.2 21.3
Research and development expenses
as percentage of net sales 5.1 6.0
Selling expenses as percentage of net sales 8.5 9.3
Administrative expenses as percentage
of net sales 1.9 1.9
Operating margin 7.0 1.5
Net sales by market area, SEK M 2015 2014 %
Western Europe 99,944 86,011 16
Eastern Europe 17,402 17,826 –2
North America 97,971 73,358 34
South America 15,611 25,837 –40
Asia 52,923 51,717 2
Other markets 19,731 21,249 –7
Total Industrial Operations 303,582 275,999 10
Impact of exchange rates on operating income
Compared with preceding year, SEK M
Industrial Operations
Net sales127,045
Cost of sales –19,658
Research and development expenses –634
Selling and administrative expenses –1,520
Other –115
Total effect of changes in exchange rates
on operating income 5,119
1 The Volvo Group sales are reported at monthly average rates.
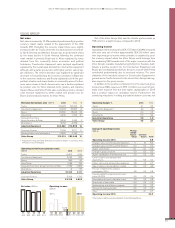
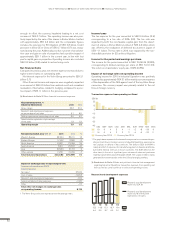
Research and development expenses
1211 15
13.3 15.4
4.4
14.6
5.0 5.1
Research and development
expenses, SEK bn
Research and development
expenses, % of Industrial
Operations’ net sales
13
15.1
5.7
14
16.7
6.0
Read more in Note 4 Goals and policies in financial risk management
regarding Industrial Operations transaction exposure from operating net
flows as well as currency effects on sales and operating income.
Transaction exposure from operating net flows1
SEK bn
–40
–30
–20
–10
0
10
20
9
11
Other
–39
–33
SEK
–8
–9
KRW
–2
–4
EUR
–1
3
BRL
4
3
ZAR
5
3
CAD
4
4
NOK
9
6
GBP
19
16
USD
Currency flow 2015 Currency flow 2014
1 The graph above represents the transaction exposure from commercial oper-
ating net cash flows in foreign currency in Industrial Operations, expressed as
net surpluses or deficits in key currencies. The deficit in SEK and KRW is
mainly an effect of expenses for manufacturing plants in Sweden and Korea,
but limited external revenues in those currencies. The EUR deficit on the
other hand, is the net of significant gross volumes of sales and purchases
made by many entities around the globe in EUR. The surplus in USD is mainly
generated from external sales within the US and emerging markets.
82